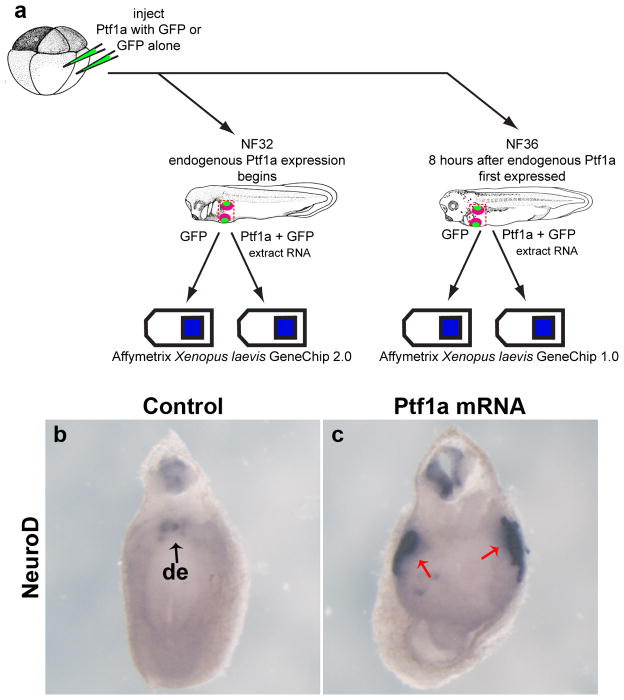
Figure 1.
Microarray experiment schematic and ISH verification. a: Schematic diagram of microarray experiment. Eight-cell stage embryos were injected with either 800pg of Ptf1a mRNA or 400pg of GFP mRNA. Samples were collected at NF32 and NF36; RNA was extracted and hybridized to Affymetrix Xenopus laevis GeneChip 2.0 and Affymetrix Xenopus laevis GeneChip 1.0, respectively. b: NeuroD expression in gfp-injected control embryos at NF32, punctate expression in the dorsal endoderm (black arrow). c: NeuroD expression in Ptf1a-injected embryos at NF32, increased expression in the dorsal endoderm (red arrows). de, dorsal endoderm.

