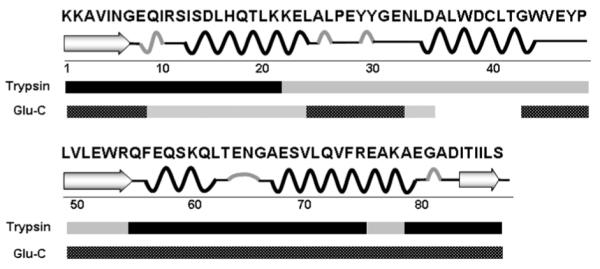
Figure 2.

Sequence coverage map of barstar resulting from trypsin and Glu-C digestion. Black bars: sequence covered with peptides giving adequate signal intensities for analysis; gray bars: sequence covered with peptides of low signal intesities owing to miscleavage or the lack of cleavable sites.
