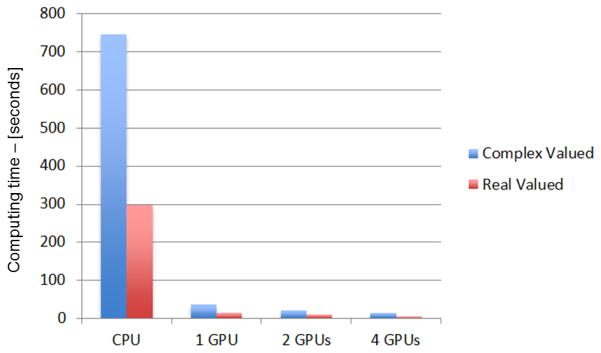
Figure 4.
Bar graph of the time, expressed in seconds, required to compute the Jacobian matrix on an Intel Xeon based PC with an optimized C-language mex file, and with dedicated routines on 1, 2, and 4 GPUs on a S1070 computing solution from NVIDIA. The blue bars report times for the complex-valued case, and red bars report times for the real-valued case.

