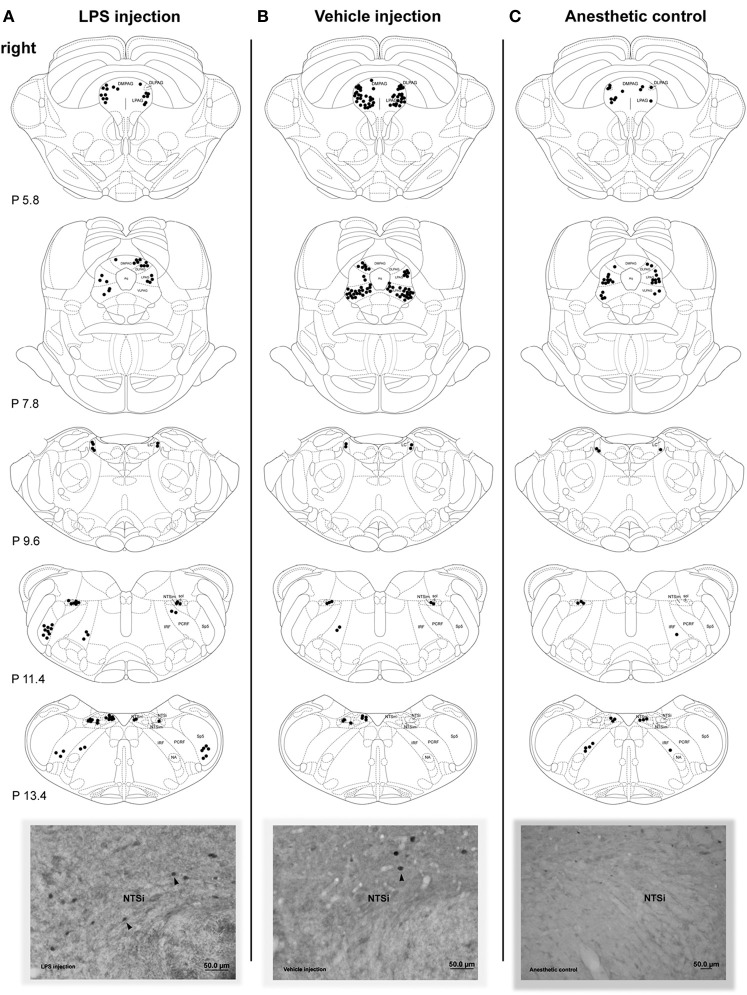
Figure 2.
Distribution of the Fos-positive neurons in the brainstem nuclei 72 h after LPS (A) and vehicle (B) injections into the right vocal fold and in anesthetic control without any laryngeal manipulations (C). Schematic diagrams depict increased FLI in a single representative animal per respective group. Corresponding photomicrographs below the diagrams show Fos activation in the right NTSi (arrowheads mark Fos-positive nuclei). DLPAG, dorsolateral nucleus of the PAG; DMPAG, dorsomedial nucleus of the PAG; LPAG, lateral nucleus of the PAG; VLPAG, ventrolateral nucleus of the PAG; IRF, intermediate reticular formation; LC, locus coeruleus; NA, nucleus ambiguus; NTS, solitary tract nucleus; NTSi, interstitial nucleus of the NTS; NTSim, intermediate nucleus of the NTS; NTSm, medial nucleus of the NTS; PAG, periaqueductal gray; PCRF, parvicellular reticular formation; sol, solitary tract; Sp5, spinal trigeminal nucleus. Diagrams were based on the atlas of the rat brain (Paxinos and Watson, 1998).

