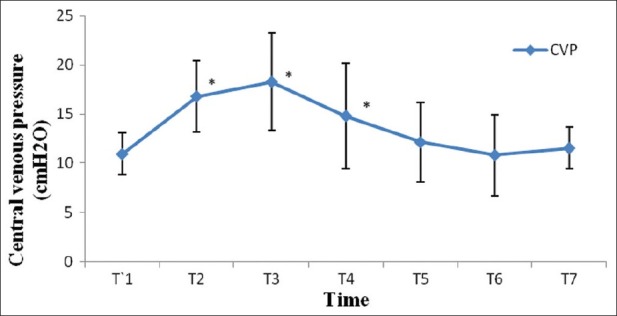
Figure 6.

Changes in central venous pressure (cm H2O) with time. T1: postinduction (baseline); T2: after CO2 pneumoperitoneum; T3: after 5 min of 45° Trendelenburg position; T4: after 20 min of 45° Trendelenburg position; T5: after 1 h; T6: after 2 h; T7: after deflation of CO2 pneumoperitoneum in the supine position. *Statistically significant compared with the baseline value (P>0.05)
