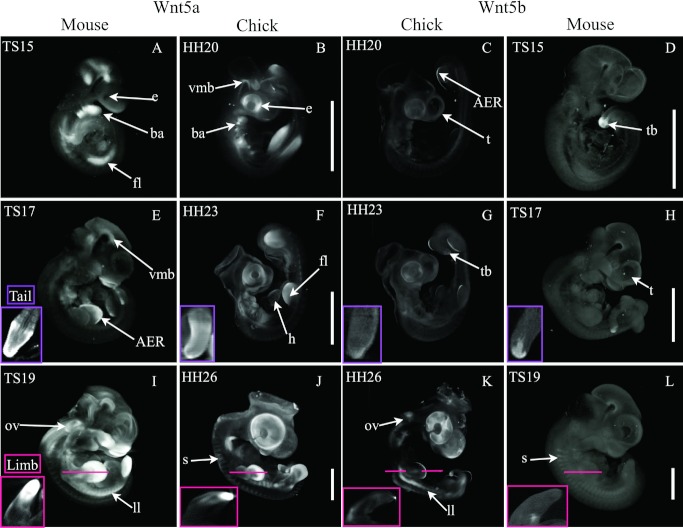
Fig 6.
Wnt5 subfamily gene expression in mouse and chick embryos at stages indicated. Main images are external views (volume rendered) of whole embryos following three-dimensional imaging (OPT): mouse Wnt5a (A, E, and I); chick Wnt5a (B, F, and J); chick Wnt5b (C, G, and K); mouse Wnt5b (D, H, and L). Virtual sections through the tail are shown inset in (E, F, G, and H). Longitudinal (dorso-ventral) sections through the limb (plane indicated) are shown inset in (I, J, K, and L). Scale bars indicate 2 mm and are indicative for each stage. Abbreviations: AER, apical ectodermal ridge; ba, branchial arches; e, eye; fl, forelimb; h, heart; ll, lateral line; ov, otic vesicle; s, somites; t, telencephalon; tb, tail bud; vmb, ventral midbrain.

