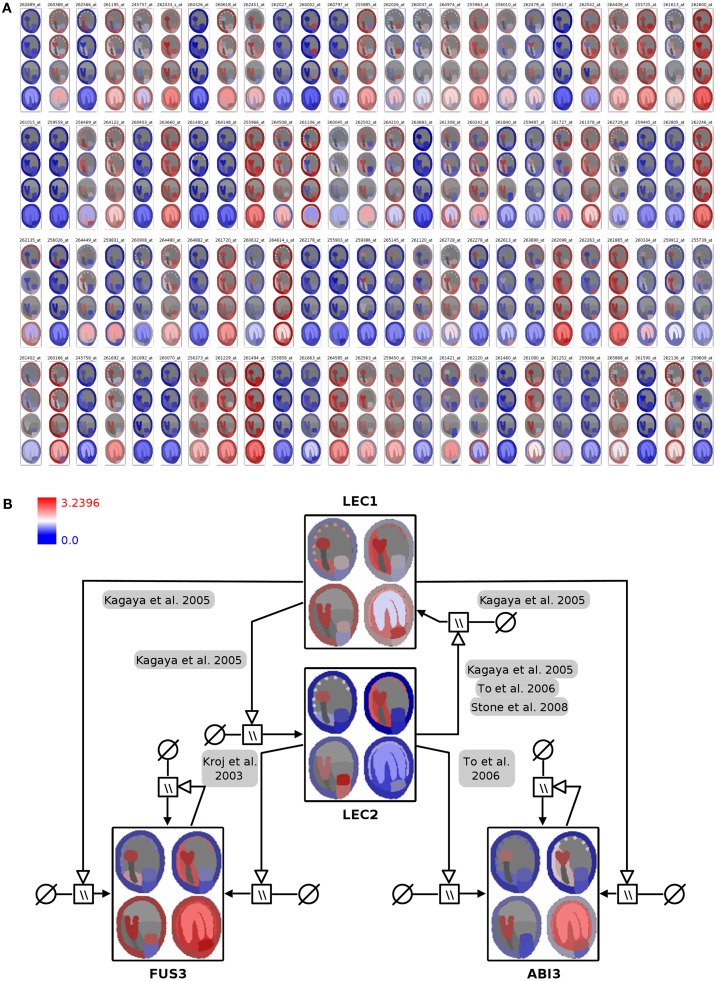
Figure 4.
Visualization of seed regulator expression profiles with spatio-temporal resolution in the context of the seed anatomical structure and gene-regulatory network. (A) Seed expression profiles of 100 Arabidopsis genes with regulatory functions, using 2D seed images for display of the corresponding spatio-temporal resolution (red: high expression; blue: low expression). (B) Integration of color-coded seed images into the LEC1/AFLB3 regulatory network. LEC1 seems to function upstream of LEC2, FUS3, and ABI3 (Meinke et al., 1994; Kagaya et al., 2005; To et al., 2006; Stone et al., 2008) whereas LEC2 in turn controls FUS3 and ABI3 (Kroj et al., 2003; To et al., 2006). During linear cotyledon and green mature stages expression of LEC1 and LEC2 ceases and expression levels of FUS3 and ABI3 stay constant due to autoregulatory loops (Kroj et al., 2003; To et al., 2006). For detailed explanations about the used SBGN Process Descriptions glyphs the reader is referred to (Junker et al., 2010). Please note that the arrangement of the four seed images was adapted from a vertical row in (A) to a 2 × 2 matrix arrangement in (B) for layout purposes.

