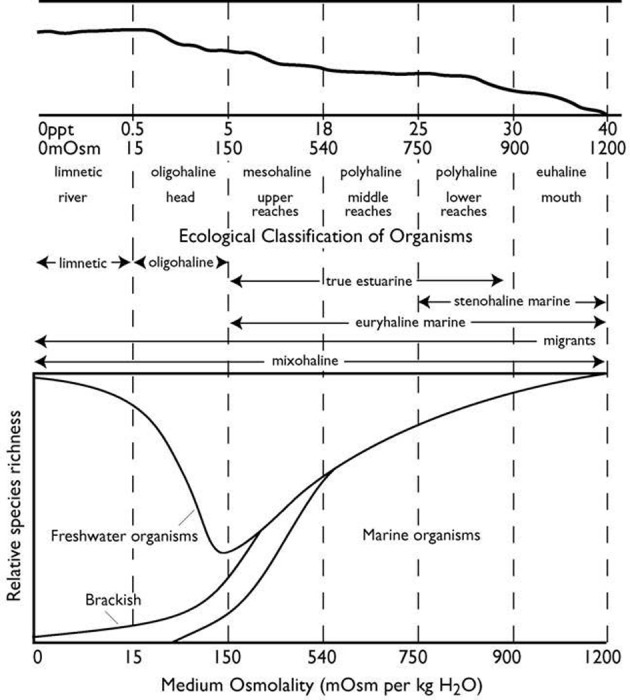
Figure 1.

Schematic representation of a typical coastal plain estuary. Top panel: longitudinal profile of the estuary; the solid sloping line represents the division between the water column above and the sediment below. The longitudinal salinity gradient of the estuary runs from riverine fresh water of 0 ppt salinity at the far left to full-strength seawater of up to 40 ppt salinity at the far right. Salinity is also shown as mosm kg−1 water. Specific zones of the estuary are based on annual salinity variation. Middle panel: ecological classification of the distributions of organisms that spend either part or all their life cycle along the salinity gradient of the estuary. Physical and ecological classification based on the “Venice” system of Carriker (1967). Bottom panel: relative species richness (number of species) of different ecological classifications found across the salinity zones of the estuary [redrawn from Gainey and Greenberg (1977), for the distribution of benthic marine and estuarine species].
