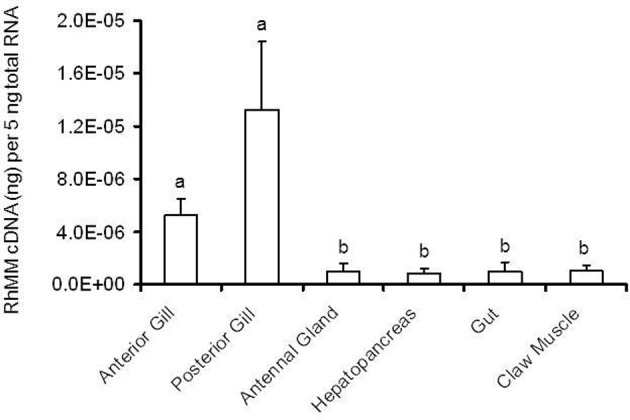
Figure 8.

Quantitative mRNA expression analysis of RhMM in various tissues of Metacarcinus magister. Significant differences of RhMM expression are indicated by different letters (a, b). Data were analyzed employing a One-Way Anova using a Tukey's pair wise comparison. Data represent means ± SEM (N = 3–5).
