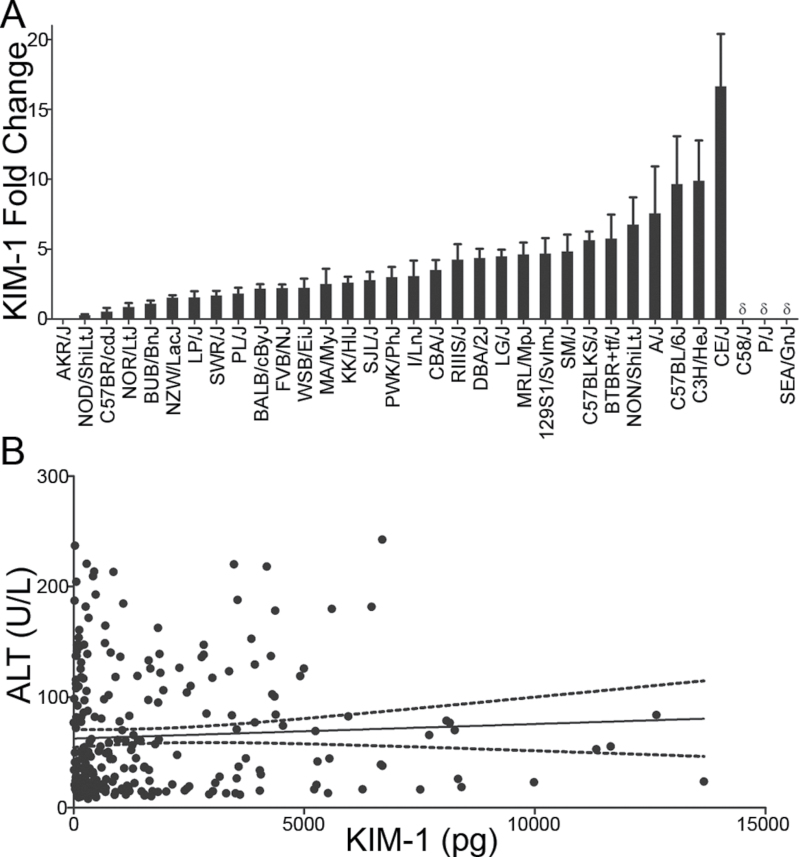
FIG. 4.
(A) Fold changes are shown as the average (± SEM) of DB289-treated animals over the average of vehicle-treated animals within a strain for urinary KIM-1 levels collected 18h prior to necropsy. δ indicates that the KIM-1 levels were below the quantifiable limit for strains C58/J, SEA/GnJ, and P/J. (B) A correlation plot is shown for ALT measured in the serum on day 11 and KIM-1 accumulation in the urine for 18h between days 10 and 11. The solid line indicates the regression line and dotted lines indicate the 95% confidence interval.

