Figure 1.
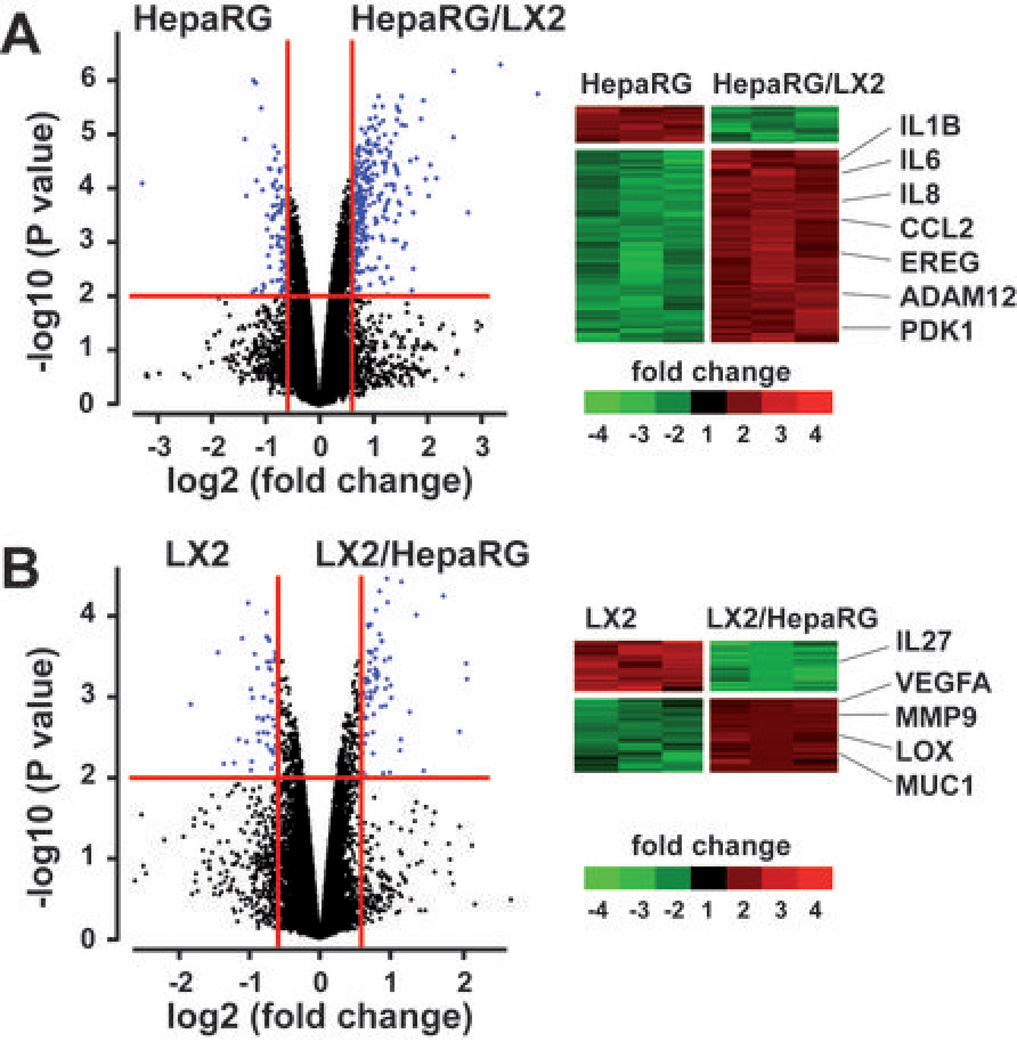
Genome-wide expression profiles changes in cocultures of HepaRG and LX2. HepaRG and LX2 cell lines were cultured alone or side by side using transwell inserts (n=3 independent culture experiments). After 48hrs, total RNA was extracted from culture and coculture experiments and subjected to a microarray analysis. (A) Volcano plot (left) and clustering analysis (right) of 212 genes differentially expressed in three independent experiments using HepaRG cultured alone (HepaRG) or in presence of LX2 (HepaRG/LX2). (B) Volcano plot (left) and clustering analysis (right) of 123 genes differentially expressed in three independent experiments using LX2 cultured alone (LX2) or in presence of HepaRG (LX2/HepaRG). In (A) and (B), RNAs were selected based on the significance of the differential gene expression in coculture vs culture conditions (horizontal red line; P<0.01) and the level of induction or repression (vertical red lines; fold-change >1.5); examples of main changes in steady-state levels of mRNAs are indicated on the right.

