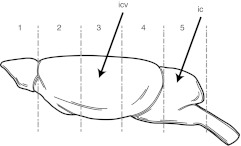
Figure 1.
Galactocerebrosidase (GALC) activity in central nervous system (CNS) of an icv-ic-treated mouse injected on PND2 and sacrificed at PND35. The diagram identifies the different CNS sections analyzed for GALC activity. The arrows point to the injection sites of injections. GALC activities expressed as nmol/h/mg protein are as follows: Section 1 (olfactory bulbs), 12.8; section 2 (forebrain), 9.7; section 3 (midbrain), 42.9; section 4 (hindbrain), 13.3; section 5 (cerebellum), 1.3; and section 6 (spinal cord), 0.4.

