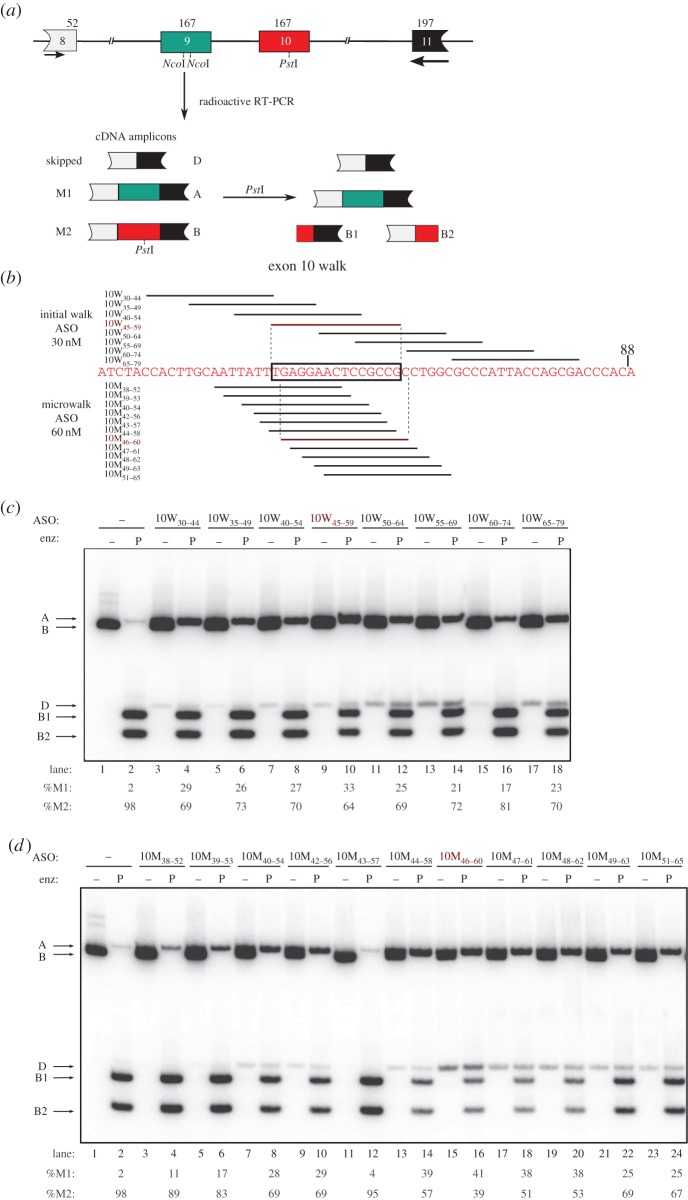
Figure 1.
Antisense oligonucleotide (ASO) walk along the 10W region. (a) Diagram of the PK-M genomic region, and the RT-PCR assay to measure M1/M2 ratios. This region comprises introns 8, 9 and 10 (represented by the lines), intact exon 9 (green box), exon 10 (red box) and portions of exons 8 (white box) and 11 (black box). Numbers above the boxes show the length in nucleotides. Primers annealing to exons 8 and 11 used to amplify the endogenous PK-M transcript are represented by the arrows. cDNA amplicons generated after radioactive PCR are shown below and labelled accordingly. Three spliced species were observed: the shorter double-skipped species, comprising only exons 8 and 11 (D, 271 nt); M1, including exon 9 (A, 398 nt); and M2, including exon 10 (B, 398 nt). To distinguish between M1 and M2, a subsequent PstI digest was carried out. Only M2 has a PstI site, resulting in two cleavage products: B1 (213 nt) and B2 (185 nt), which are the 3′ and 5′ ends of M2, respectively. (b) Scheme of the ASO screen focused on the 10W region. The sequence of exon 10 from 25 to 88 nt upstream of the 5′ splice site (ss) is indicated in red. Stacked lines represent individual ASOs and are aligned to the complementary sequence in exon 10. The ASO names are indicated on the left, with the subscript numbers indicating the target-sequence coordinates. The initial ASO walk is represented at the top, with ASO 10W45–59 indicated in red and shown to be annealing to the 10W region (bounded by the rectangle) by vertical dashed lines. The microwalk ASOs are indicated below, and the complementary sequence targeted by ASO 10M46–60 is indicated with vertical dashed lines. (c,d) ASO walks. Radioactive RT-PCR and restriction digest of endogenous PK-M transcripts in HEK-293 cells after transfection of ASOs. Initial walk ASOs, transfected at 30 nM, are shown in (c), and microwalk ASOs transfected at 60 nm are shown in (d). RNAs were harvested from cells 48 h after transfection. The transfected ASO is indicated at the top. cDNA amplicons and fragments are indicated on the left. Lane numbers and quantifications are indicated at the bottom. Each product was quantified as a percentage of the total of M1, M2 and double-skipped species. %M1 and %M2 are shown. All standard deviations are ≤4% (n = 3).

