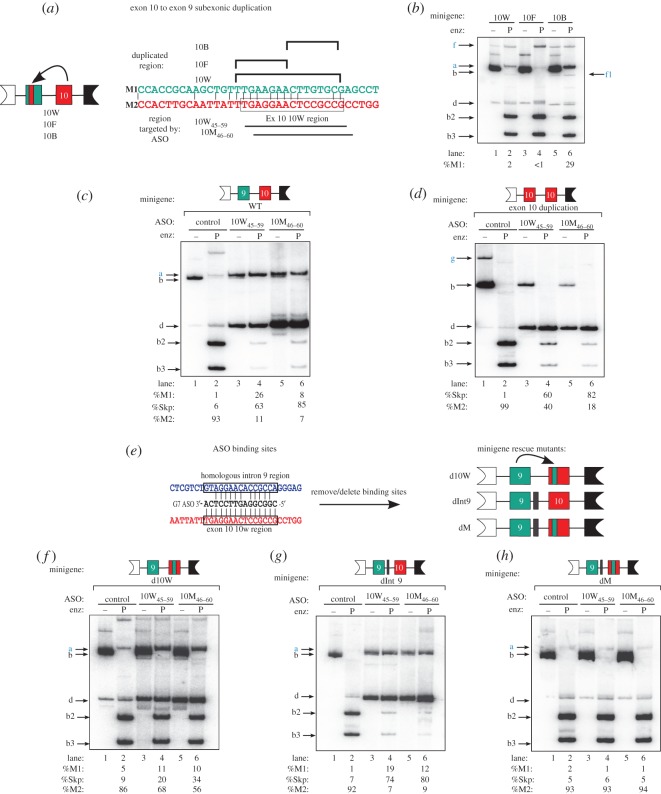
Figure 2.
Characterizing the 10W ASO target region. (a) Scheme of method used to duplicate the exon 10 10W region into exon 9 in a minigene. The minigene comprises the same genomic region as indicated in figure 1a. To amplify minigene transcripts, we used a primer annealing to a vector-specific sequence upstream of the genomic insert, pcDNAF [14]. Minigene mutant names are indicated below. The indicated exon 9 (green) nucleotides at the top were mutated to the corresponding exon 10 (red) sequences on the right. The 10W minigene duplicates the entire exon 10 10W region into exon 9; the 10F minigene duplicates the first 8 nt of 10W45–59; and the 10B minigene duplicates the last 7 nt of 10W45–59. The ASOs that target 10W and the flanking regions are indicated below. (b) The 10W region is an exon 10 ESE. Mutant minigenes were analysed by transient transfection into HEK-293 cells, followed by radioactive RT-PCR and restriction digestion, as in figure 1. Constructs from (a) are labelled at the top. Labelled bands are indicated in lower case on the left and right, with important bands in blue font. %M1 is indicated at the bottom. Bands are as follows: uncut M1 fragment (a, 481 nt); uncut M2 fragment (b, 481 nt); PstI-cleaved M2 5′ fragment (b2, 268 nt); PstI-cleaved M2 3′ fragment (b3, 213 nt); a spliced mRNA that skips both exons 9 and 10 (d, 314 nt); an exon 9–exon 10 doubly included mRNA expressed from the 10B minigene (lanes 5 and 6) is indicated on the left (f, 648 nt). This band is sensitive to PstI (f1, 435 nt). Standard deviations (s.d.) are 0.2%, 0.3% and 2.6% for 10G, 10F and 10B, respectively; n = 3. (c,d) Minigene transcript-level changes as a result of ASO co-transfection in HEK-293 cells. ASOs were transfected at a nominal final concentration of 60 nM. The wild-type (c) and exon 10 duplication (d) minigenes [14], together with the identity of the ASOs, are indicated at the top. Labelled bands are indicated in lower case on the left, with important bands in blue font. The exon 10–exon 10 doubly included mRNA in (d) expressed from the exon 10 duplication minigene is indicated on the right (g, 648 nt). %M1, %M2 or %Skp is indicated at the bottom. Standard deviations for (c) are 0.6%, 4.2% and 2.9% for control, 10W45–59 and 10M46–60, respectively; s.d. for (d) are 0.8%, 9.4% and 2.6% for control, 10W45–59 and 10M46–60, respectively; n = 3. (e) Diagram of a homologous potential cross-hybridizing region for ASOs 10W45–59 and 10M46–60 ASOs. Alignment of the sequences of ASO 10W45–59, the complementary region in exon 10 (indicated in red), and a homologous region in intron 9 (indicated in blue, 129–156 nt upstream of the exon 9 5′ss) is shown. Vertical lines indicate sequence identity. Diagram of minigene mutants used in (f–h) is shown on the left. d10W has the 10W ASO binding site in exon 10 removed and replaced by the corresponding region in exon 9. dInt9 has a 15 nt deletion of the homologous intron 9 region (e). dM has both mutations. (f–h) Minigene transcript-level changes as a result of ASO co-transfection in HEK-293 cells. ASOs were transfected at a final nominal concentration of 60 nM. The minigenes, together with the identity of ASOs, are indicated at the top. Labelled bands are indicated in lower case on the left, with important bands in blue font. ASOs and minigenes from (e) are indicated at the top, %M1 is indicated at the bottom and bands are indicated on the left. %M1, %M2 or %Skp is indicated at the bottom. Standard deviations for (f) are 1.2%, 1.6% and 1.5%; for (g) they are 0.4%, 2.0%, 3.9%; and for (h) they are 0.2%, 0.6% and 0.6%, corresponding to control, 10W45–59 and 10M46–60 ASOs, respectively; n = 3.

