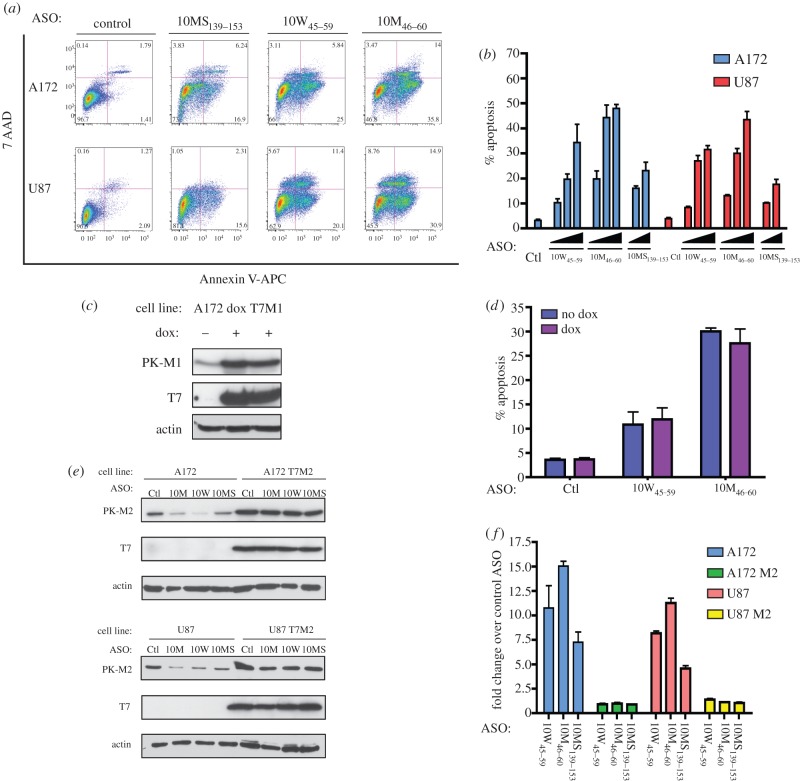
Figure 4.
Effects of ASOs on glioblastoma cells. (a,b) Exon 10 ASOs induce apoptosis in glioblastoma cells. (a) U87-MG or A172 cells were transfected with the indicated ASOs at a nominal final concentration of 90 nM, stained with Annexin V-APC/7-AAD 36 h after transfection and analysed by flow cytometry. The percentage of Annexin-V-positive cells is indicated for the two right quadrants in each plot. Each plot is a representative of three biological replicates. (b) ASO-induced apoptosis is dose-dependent. The indicated cells were transfected with ASOs 10W45–59 or 10M46–60 at 30, 60, or 90 nM, or ASO 10MS139–153 at 60 or 90 nM. The control (Ctl) ASO was transfected at 90 nM. The percentage of Annexin-V-positive cells is plotted for each condition. The identity and dose of ASOs are indicated below the x-axis. Error bars represent s.d. (n = 3). (c,d) Role of PK-M1 protein isoform in apoptosis induction. (c) Immunoblot analysis of A172 cells stably transduced with rtTA and doxycycline (dox)-inducible human T7-tagged PK-M1 cDNA. Cells were grown in parallel, with or without doxycycline, and harvested after 72 h. Antibodies used are indicated on the left. (d) Cells were grown as in (c) and then transfected with the indicated ASOs at 60 nM. Cells were then stained and analysed for Annexin V 36 h after transfection. Histograms indicate the percentage of Annexin-V-positive cells for each condition. Doxcycyline on/off conditions are indicated on the left. Error bars represent s.d. (n = 3). (e,f) Role of PK-M2 protein isoform in apoptosis induction. A172 or U87 cells were stably transduced with T7-tagged human PK-M2 cDNA; transductants and the parental cell lines were transfected with the indicated ASOs at a nominal final concentration of 90 nM. (e) Immunoblot analysis of cells transfected with the indicated ASOs. Antibodies used are indicated on the left. (f) ASO-transfected cells were analysed for Annexin V as in (d). Histograms indicate the fold increase in Annexin-V-positive cells, compared with control ASO, for each cell line. Error bars represent s.d. (n = 3).

