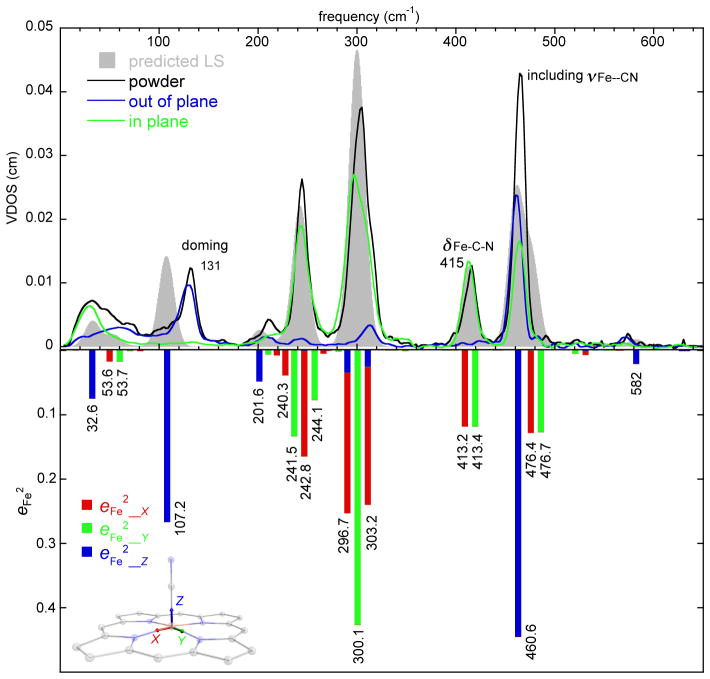
Figure 2.
(Upper panel) The measured VDOS for the powder sample (17 K), the single crystal sample (in-plane, 116 K; out-of-plane, 116 K) of [K(222)][Fe(TPP)(CN)], and predicted VDOS for the low spin state (grey shaded, G09). (Lower panel) The predicted directional characteristics of all modes with are shown. The tick marks are the values of the predicted frequencies, but the horizontal scale is only approximately linear in frequency to avoid overlaps. x, y and z are illustrated in the molecular structure and defined in text.

