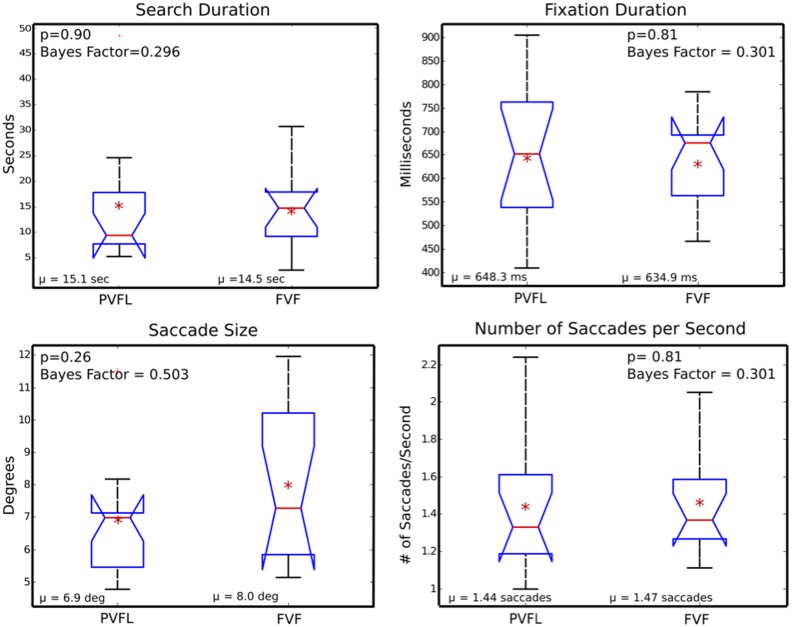
Figure 2.
Oculomotor summary measures. Box plots of search duration, fixation duration, saccade size, and number of saccades per second, averaged across peripheral visual field loss (PVFL) patient and full visual field (FVF) groups. The red line indicates the median for each distribution and the edges of the box display the 25th and 75th percentile. The red asterisk indicates the mean of each distribution and a red cross marks outliers. Comparison intervals are shown with notches. Whiskers display the minima and maxima of the distributions (excluding outliers). None of the parameters were significantly different between PVFL and FVF groups (p values and Bayes Factors shown inset). Bayes factors are listed in the form alternative/null.

