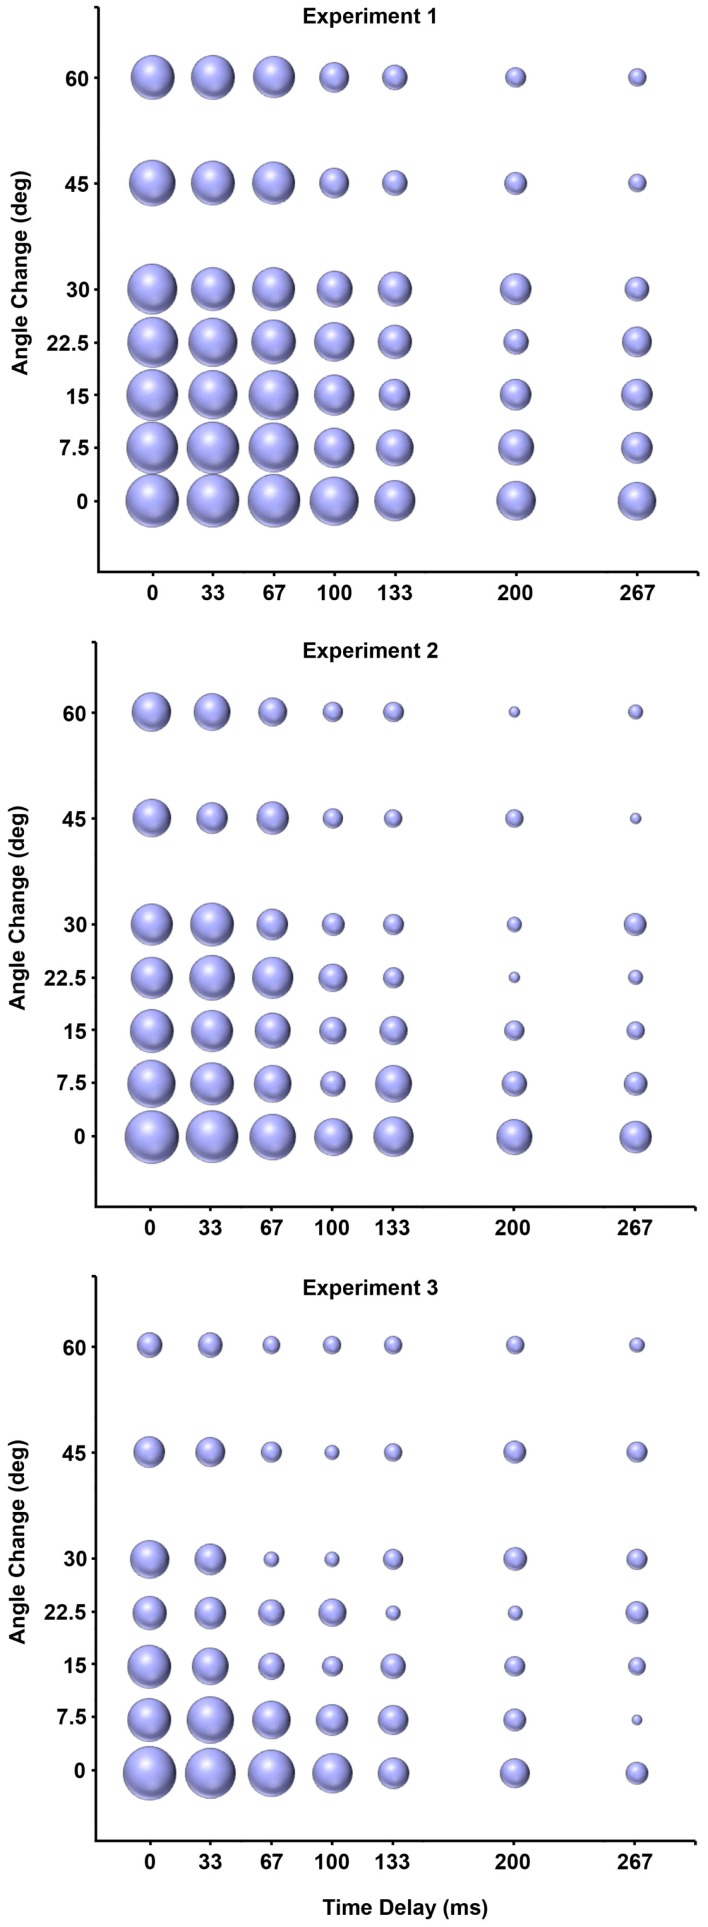
Figure 2.
Change in the percent of temporal and spatial parameter combinations judged causal across experiments (Top: Experiment 1, Middle: Experiment 2; Bottom: Experiment 3). Bubble area represents the percentage of a unique parameter combination (e.g., 33 ms delay × 15° angle change) judged causal. Increased bubble sizes for shorter delays and smaller angle changes, relative to longer delays, and angle changes, demonstrates that participants were more likely to judge shorter delays and angles as causal. Decreased size of bubbles across experiments demonstrates the effects of increased exposure to direct causal launches across experiments. Means for direct launches were calculated based on different numbers of trials in each experiment (Experiment 1 = 2; Experiment 2 = 32; Experiment 3 = 288 trials).

