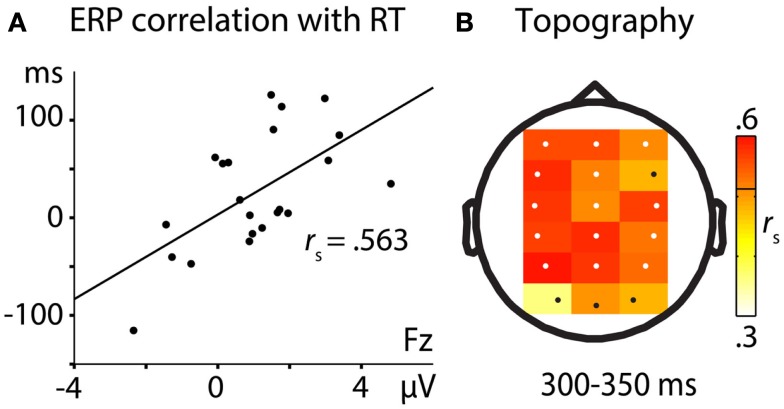
Figure 3.
Correlation of ERP differences (think – no-think) with RT differences (no-think – baseline). (A) Correlation at electrode Fz. The positive correlation is indicating more RT memory impairment with more negative no-think ERPs. (B) Topographical distribution of correlation effects at the 18 electrodes selected for statistical analysis. Significant electrodes (p < 0.05) are depicted in white. The threshold for significant correlation (rs > 5.121) is depicted as a black line in the color bar.

