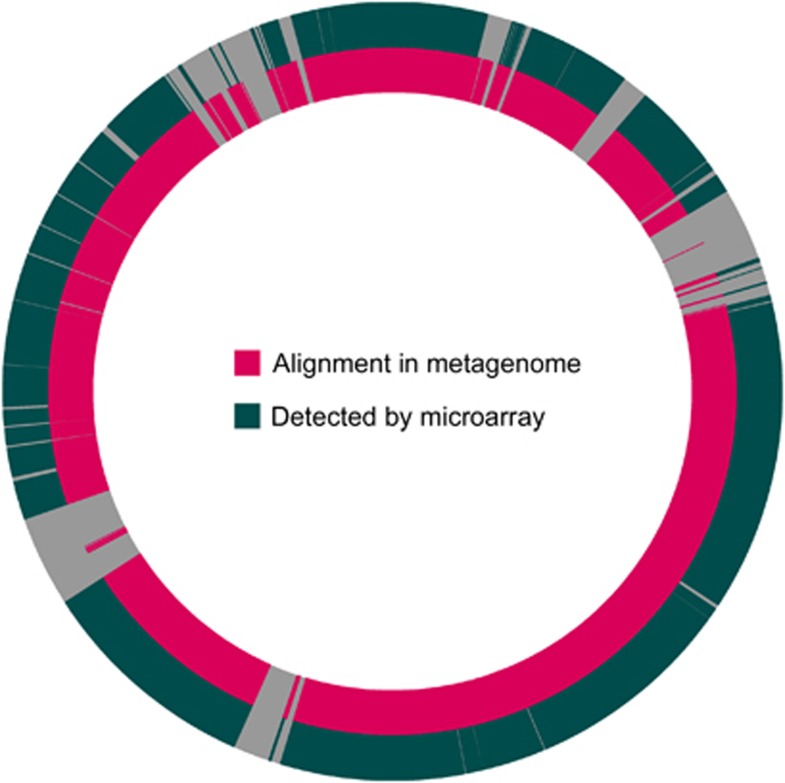
Figure 4.
Comparison of metagenomic Dhc coverage with ANAS genes detected by microarray. Although the analysis was performed for genes from Dhc strains 195, BAV1, CBDB1 and VS, only results for Dhc strain 195 are shown here for simplicity. Circles represent the Dhc strain 195 genome, with the origin of replication at the top. The inner circle shows regions with ANAS metagenome / strain 195 alignments in magenta. The outer circle shows ANAS genes detected by microarray in blue-green.

