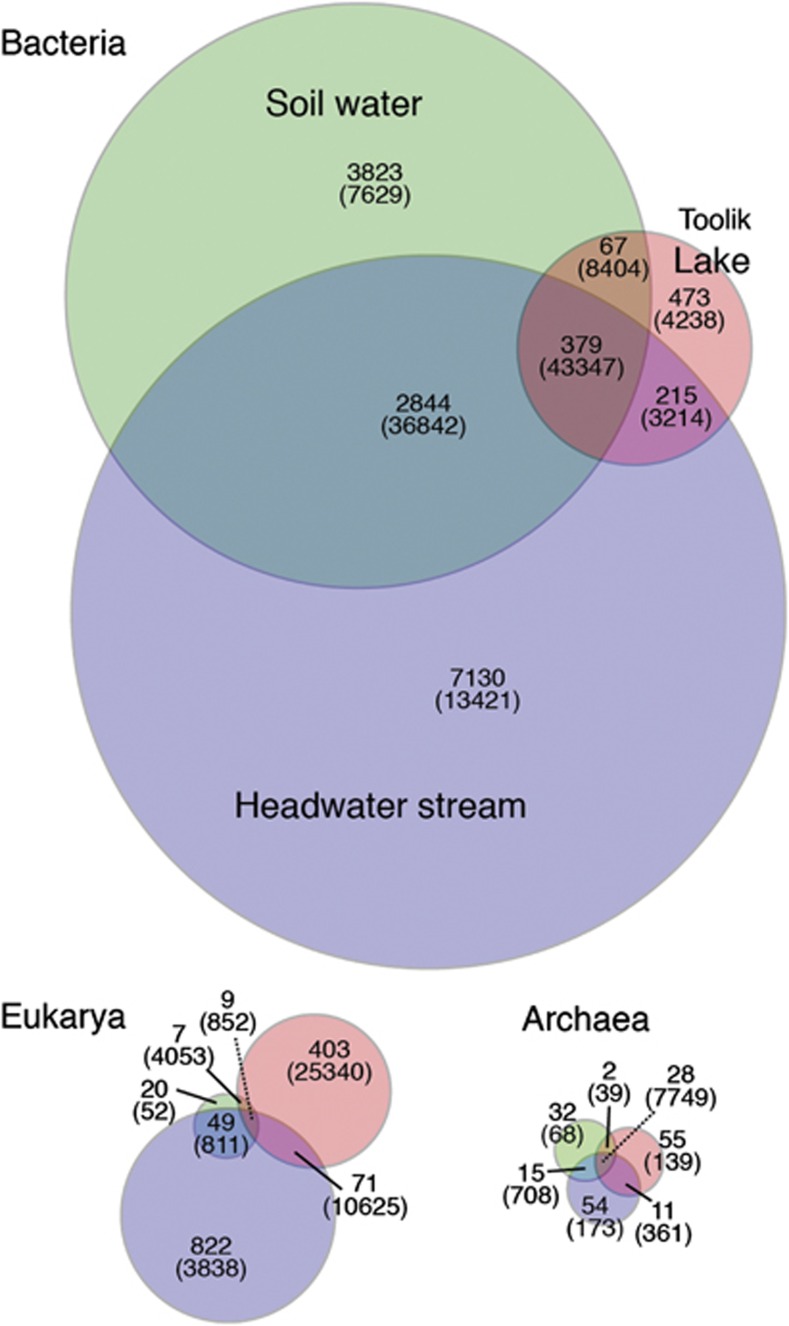
Figure 5.
Venn diagram showing the number of shared Bacterial, Archaeal and Eukaryotic taxa (in bold) among soil water, headwater stream and lake samples for pooled sequences from duplicate samples. The number of sequences associated with taxa is shown in parentheses. Taxa are defined by 97% sequence similarity. Circled areas are proportional to the number of taxa detected in each environment.

