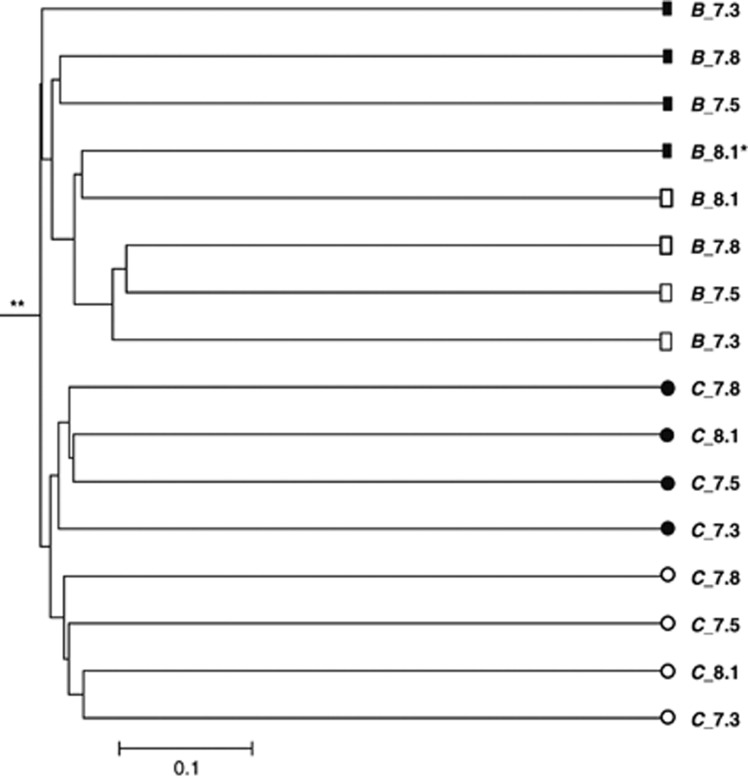
Figure 3.
Cluster analysis of microbial community 16S rRNA clone libraries generated from the tissues and skeletons of B. europaea and C. caespitosa exposed to four pH conditions. Cluster analysis was performed by cluster environment using unifrac P-value (Unifrac Metric analysis) (Lozupone and Knight, 2005) n=2652. Squares represent the coral B. europaea (B), circles represent C. caespitosa (C), and the fractions are divided into tissue (black) and skeleton (white). *Note that 8.1 (microbes generated from B. europaea tissue exposed to ambient pH) clusters with B. europaea skeleton fraction communities. **Significant differences between the tree clusters. The bar represents a weighted UniFrac distance of 0.1.

