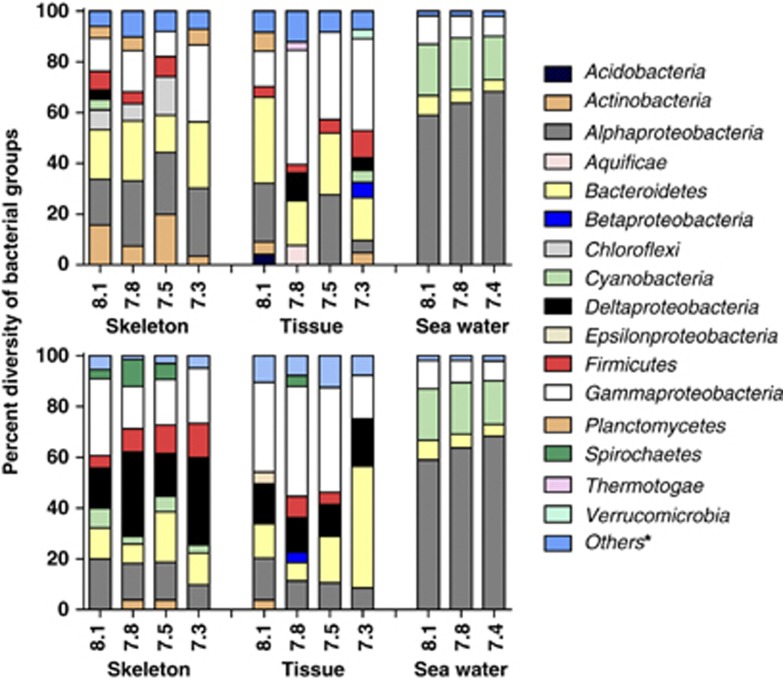
Figure 4.
The impact of pH on the bacterial groups associated with tissue and skeleton composition and relative abundance of C. aespitosa and B. europaea, as well as the surrounding water. The chart was constructed based on the 16S rRNA gene sequences in clone libraries generated from the corals (top) C. caespitosa (n=1354), (bottom) B. europaea (n=1298) and sea water (n=2029). *Classes under 3%.

