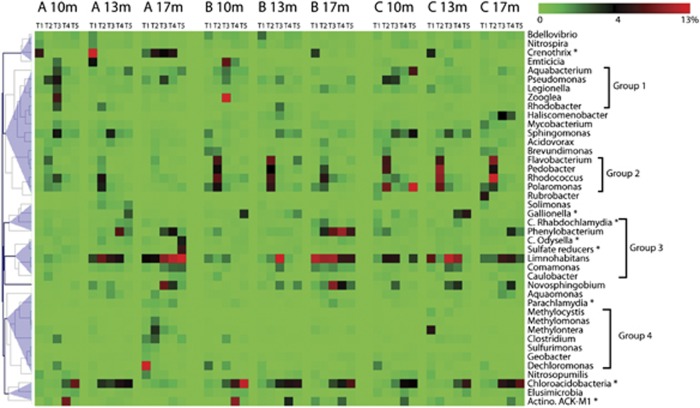
Figure 5.
Relative abundance of genus-level OTUs (identified as feature OTUs by Random Forest analysis) at 10, 13 and 17 m in well clusters A, B or C. OTU abundances were averaged within each time cluster: T1 (16 November–1 December), T2 (26 January–10 March), T3 (14 May–14 June), T4 (15 June–8 July) and T5 (9 July–24 September). Stars highlight some taxa with distinctive distribution patterns.

