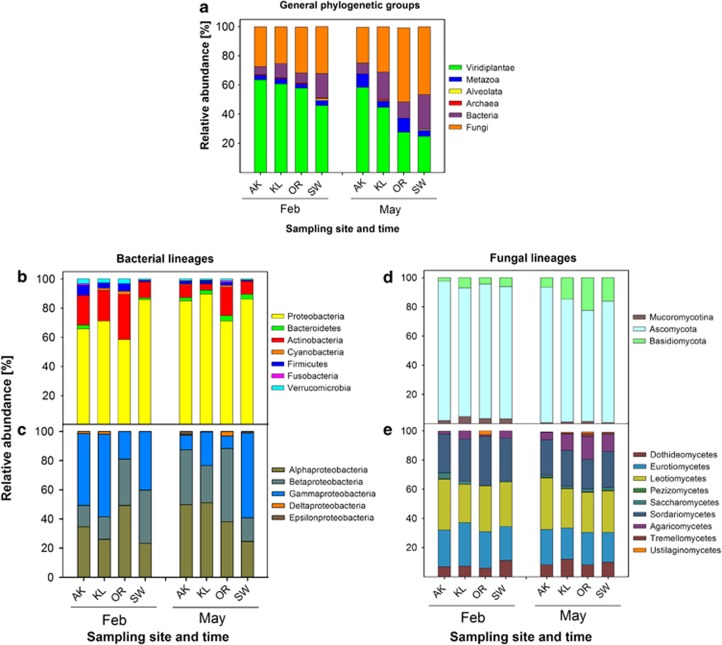
Figure 1.
Assignment of spectra to taxonomic groups of organisms at different sampling times and sites. Relative abundances were calculated from the sum of NSAFs found for each group at the respective sampling sites and time. (a) General taxonomy, (b) Bacterial phyla, (c) Proteobacteria, (d) Fungal phyla, (e) Fungal classes. Groups are only presented if their relative abundance is >0.5% in the respective sample. Sampling sites are presented according to increasing mean air-temperature (from left to right).

