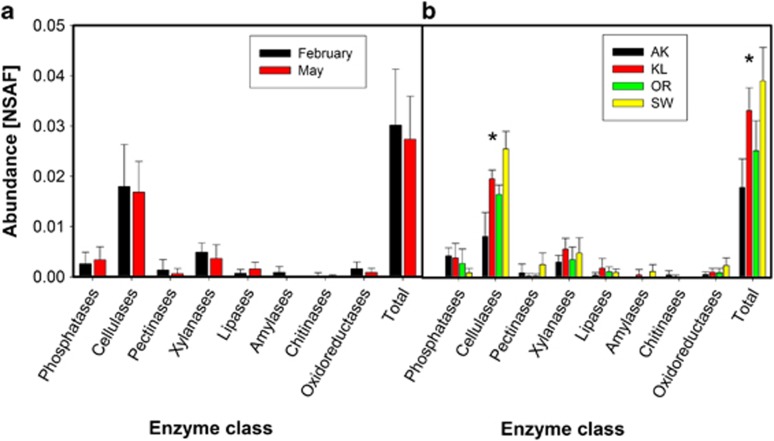
Figure 3.
Relative abundance of hydrolytic enzymes at different sampling times and sites. (a) Abundance of different enzymatic classes at different sampling times. Data represent mean±SD of eight samples collected at the respective sampling time. No significant differences among sites were detected by t-test analysis. (b) Abundance of different enzymatic classes at different sampling sites. Data represent mean±SD of four samples collected at the respective sampling site. *Represent significant differences, P<0.05, ANOVA followed by LSD-test.

