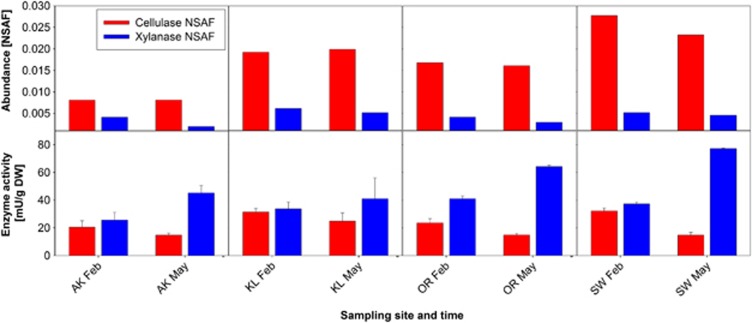
Figure 4.
Comparison of cellulase and xylanase abundance and total cellulolytic and xylanolytic activities. The upper part of the figure shows enzyme abundances based on NSAFs. Data represent the mean of two biological replicates. The lower part of the figure shows enzyme activities based on photometric assays. Data represent the mean±SD of three biological replicates.

