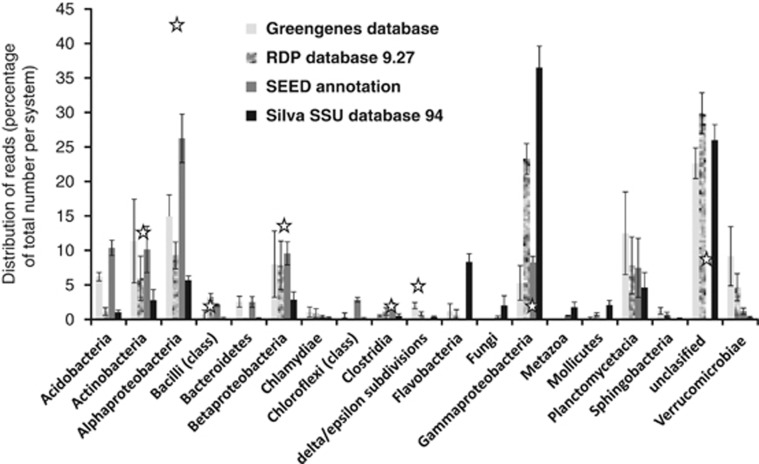
Figure 4.
Relative distribution of microbial classes in the Rothamsted soil metagenome. SD correspond to the fluctuation of the relative distribution between different pyrosequencing runs. The total number of reads annotated by the different methods is not the same as the SEED annotation using all annotated reads and the others use only identified 16S rRNA genes (rrs). The version of Greengenes database used within MG-RAST was from 2008. The stars represent the relative distribution among the 100 largest contigs after assembly based on SEED annotation.

