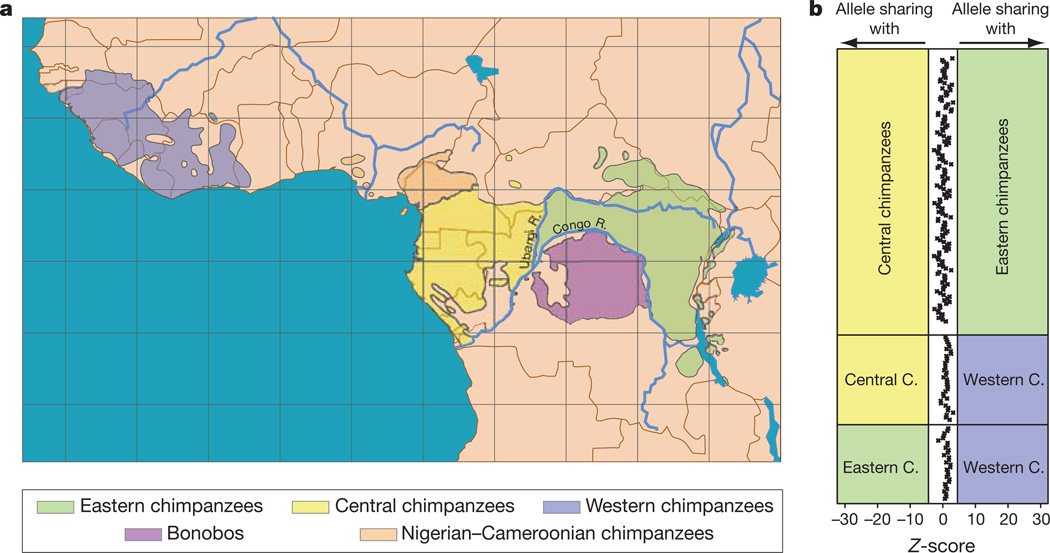
Figure 1. Geographical distribution and test for admixture between chimpanzees and bonobos.
a, Geographical distribution of bonobos and chimpanzees. b, D statistics for the admixture test between bonobos and three chimpanzee groups. Each pairwise comparison between one bonobo and two chimpanzee groups is depicted as one panel. Each point in a panel represents one bonobo individual compared with two chimpanzee individuals from different groups. Admixture between bonobo and chimpanzee is indicated by a Z-score greater than 4.4 or less than −4.4.

