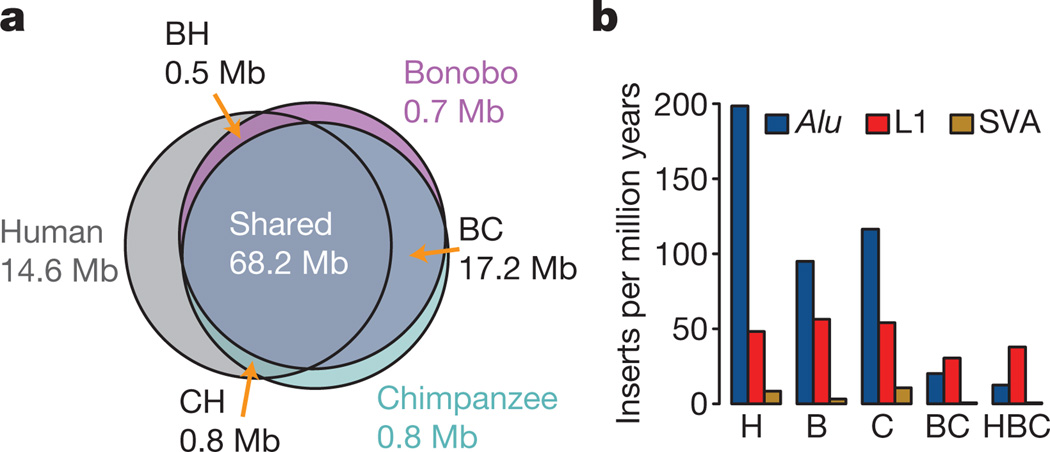
Figure 2. Segmental duplications and transposon accumulation.
a, Venn diagram showing segmental duplications in the human (H), chimpanzee (C) and bonobo (B) genomes. Each number of megabases refers to the total amount of sequence that occurs in segmental duplications (Supplementary Information, section 4). b, Accumulation of different retrotransposon classes on each lineage.

