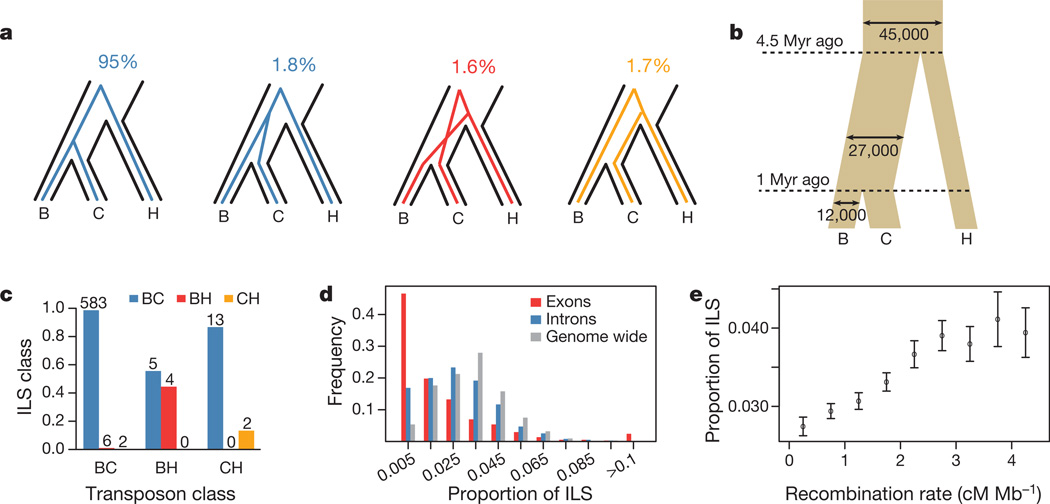
Figure 3. Incomplete lineage sorting.
a, Schematic description of ILS states and percentage of bases assigned to each state. b, Effective population sizes and split times inferred from ILS and based on a molecular clock with a mutation rate of 10−9 yr−1. Myr, million years. We note that other estimates of mutation rates will correspondingly affect the estimates of the split times. c, Overlap between predicted ILS transposons and the closest HMM ILS assignments within 100 bp of a transposon insertion. d, Proportion of ILS in exons, introns and across the whole genome, counted within ~1-Mb segments of alignment (Supplementary Information, section 8). e, Proportion of ILS dependent on recombination rates. Errors, 95% confidence interval.

