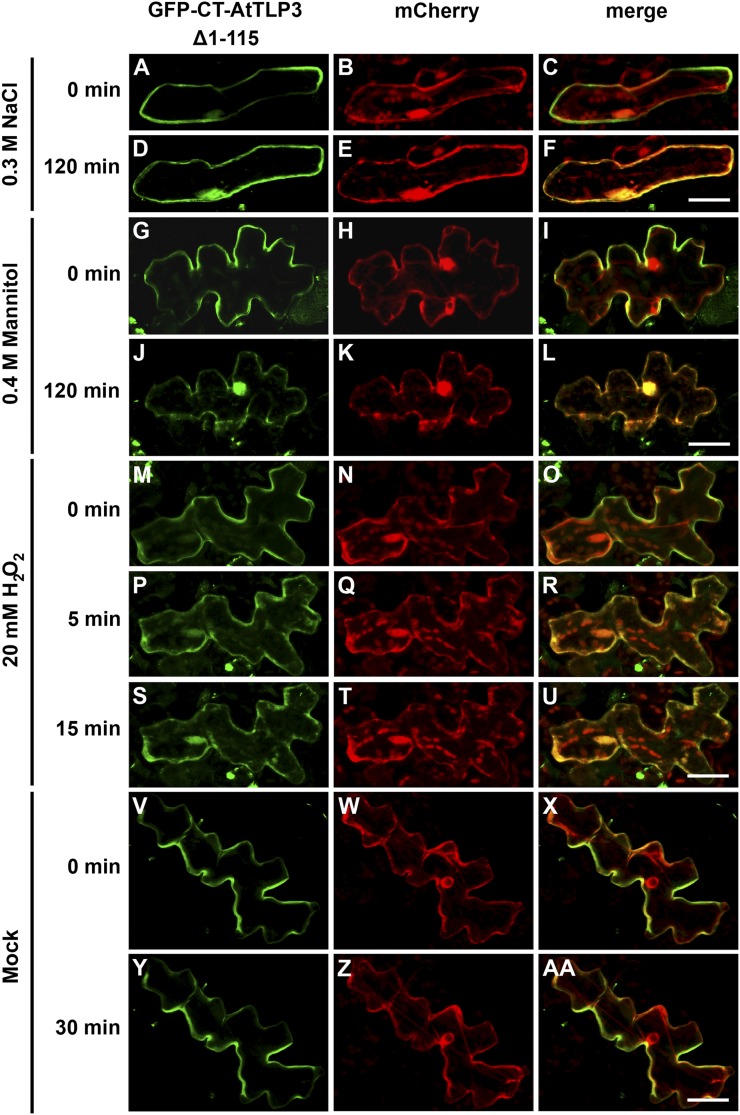
Figure 6.
Osmotic stress-induced translocation of the membrane-tethered AtTLP3 Tubby domain to plastids. A, D, G, J, M, P, S, V, Y, Arabidopsis leaf cells were transformed with GFP-CT-AtTLP3 (Δ1–115). B, E, H, K, N, Q, T, W, Z, Arabidopsis leaf cells were transformed with the cytosolic and nucleoplasmic marker mCherry. C, F, I, L, O, R, U, X, AA, Merged images indicate the subcellular localization of truncated domain versions. Yellow color indicates the colocalization of green- and red-fluorescing proteins. A to F, Application of 0.3 m NaCl results in the relocalization of the C terminus of AtTLP3 [GFP-CT-AtTLP3 (Δ1–115)] from the PM (A–C) to the cytosol and nucleus within 120 min (D–F). G to L, Application of 0.4 m mannitol results in the relocalization of GFP-CT-AtTLP3 (Δ1–115) from the PM (G–I) to the cytosol and nucleus within 120 min (J–L). Exposure of cells to mannitol caused plasmolysis, thereby slightly changing the shape of cells (J–L). M to U, Application of 20 mm H2O2 results in the relocalization of GFP-CT-AtTLP3 (Δ1–115) from the PM to the cytosol and nucleus. M to O, PM localization of GFP-CT-AtTLP3 before treatment (0 min). P to R, Cytosolic and nucleoplasmic localization of GFP-CT-AtTLP3 (Δ1–115) at 5 min after application of 20 mm H2O2. S to U, Cytosolic and nucleoplasmic localization of GFP-CT-AtTLP3 (Δ1–115) at 15 min after application of 20 mm H2O2. V to AA, PM localization of GFP-CT-AtTLP3 (Δ1–115) at 0 and 30 min after mock treatment. Experiments were repeated three times with similar results. Bars = 20 µm.

