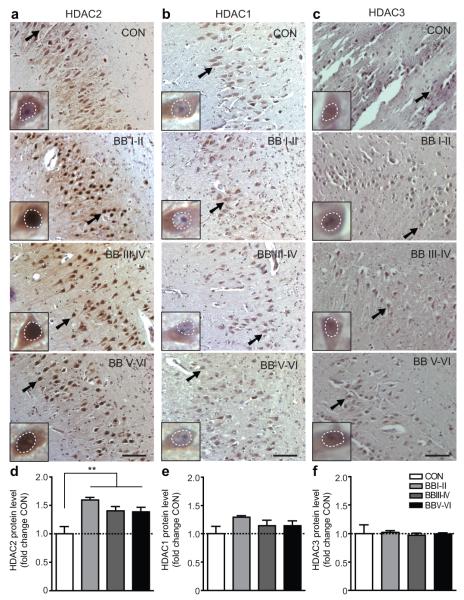
Figure 4. HDAC2 expression is increased in Alzheimer’s disease patients.
a-c, Representative immunohistochemical images depicting nuclear HDAC1-3 levels (white dotted circles) in neurons (arrow points to magnified neuron in inset) of hippocampal area CA1 from patients with Braak and Braak (BB) stages I/II (n=4), III/IV (n=7) and V/VI (n=8) compared to healthy BB0 control brains (CON, n=7); scale bar, 100μm. d-e, Quantitative assessment of (a-c). **p≤0.01, values are mean ± s.e.m.

