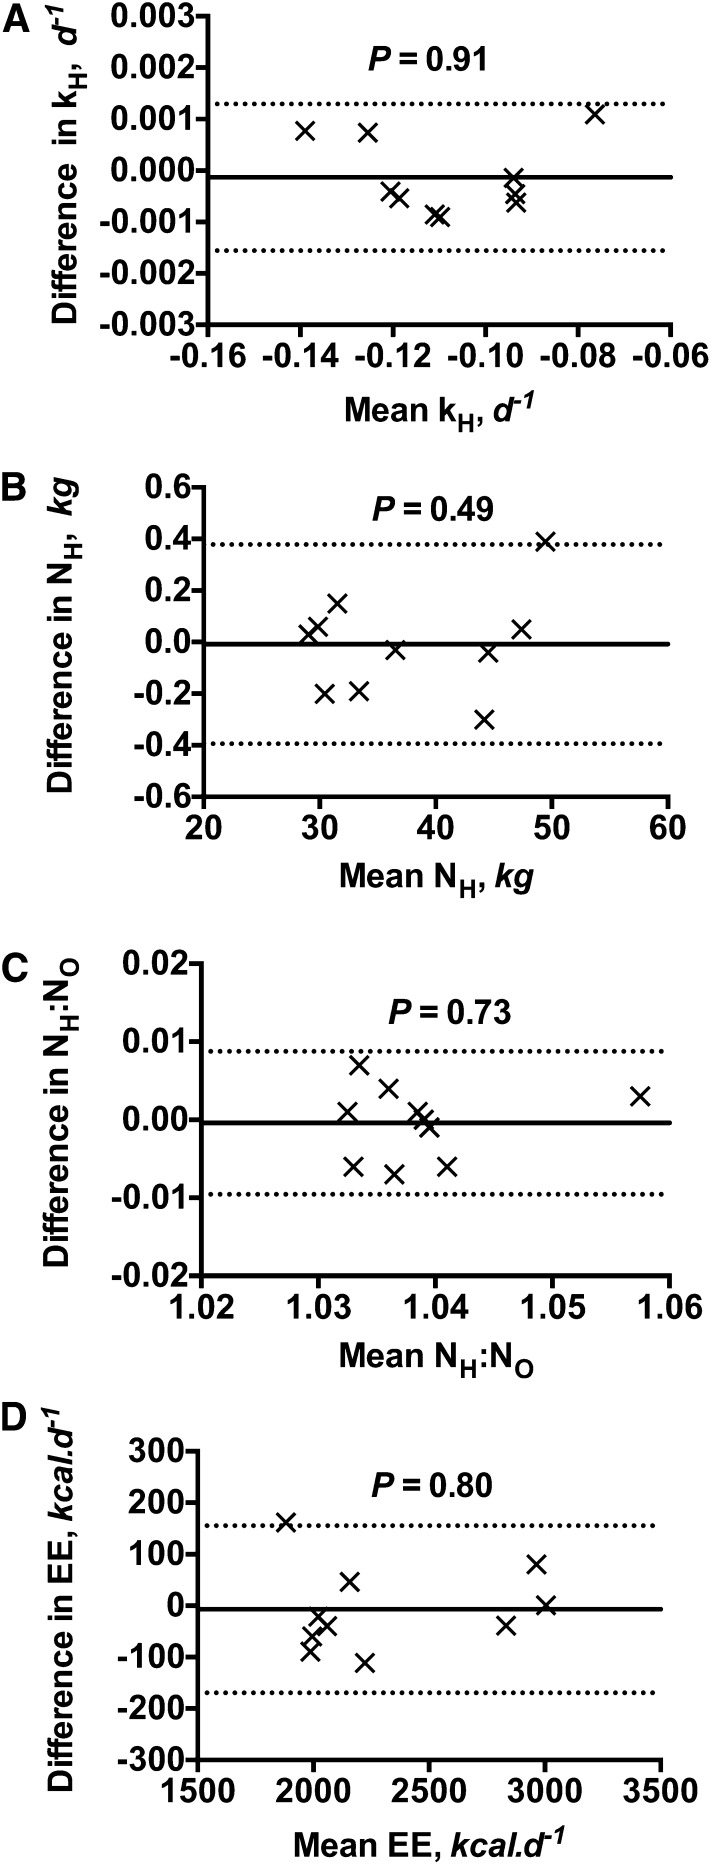
FIGURE 1.
Bland and Altman pairwise comparison of the DLW outcome variables: kH (A), NH (B), NH:NO (C), and EE (D) generated from urine samples collected in 10 DLW human studies by the platinum catalyzed H2-water equilibration method and the reference zinc reduction method. The y-axis represents the differences between the 2 measurements. The x-axis represents the means between the 2 measurements. The solid lines represent the bias and the dashed lines represent the lower and upper limits of agreement. The P value in each figure represents the significant value by linear regression analysis between the differences and the mean values. DLW, doubly labeled water; EE, energy expenditure; H2, hydrogen gas; kH, fractional turnover rate of deuterium; NH, isotope dilution space of deuterium; NH:NO, ratio between the isotope dilution spaces of deuterium and oxygen-18.

