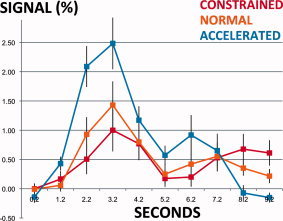
Figure 6.

FFG BOLD signal response during constrained, normal, and accelerated fluent sentence reading. Scale: 0 and 1 are minimum and maximum BOLD responses for the constrained reading condition. Error bars: standard error of measurement. FFG region: point of peak difference for contrast [accelerated > constrained fluent sentence reading]. [Color figure can be viewed in the online issue, which is available at wileyonlinelibrary.com.]
