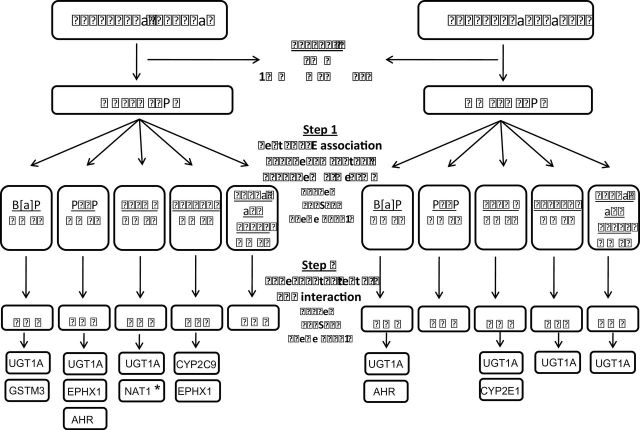
Fig. 1.
Schematic representation of the two-step test for G×E interaction of Murcray et al. (31). We first excluded SNPs with call rate <90%, minor allele frequency (MAF) <1% in the adenoma set and 5% in the cancer set, or Hardy–Weinberg Equilibrium (HWE) P-value <1×10⁻⁶ among Caucasian controls. In Step 1 of the test G×E interaction, G–E association were first tested in the combined case and control sample. Only SNPs with P < 0.10 in Step 1 are then tested for G×E interaction using a standard case–control analysis in Step 2. We further explored the risk pattern for all interactions that met the unadjusted significance threshold of 0.05 (see Tables 3 and 4). *Significant after adjustment for multiple testing at P < 0.05.

