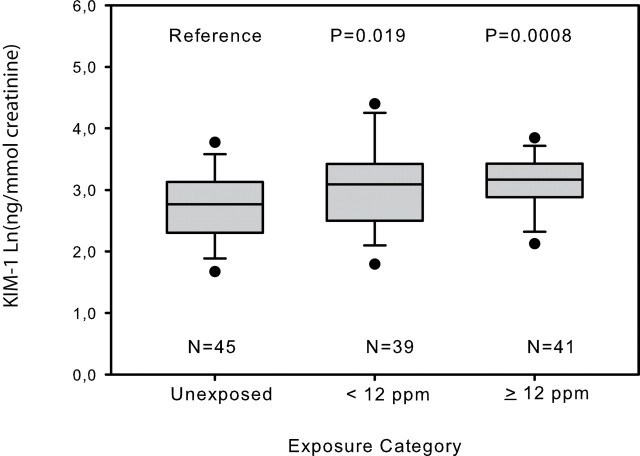
Fig. 1.
Box and whisker plot, demonstrating the median (line), lower and upper interquartile range (IQR; box) and whiskers to the highest and lowest values, excluding outliers (>1.5 times IQR; open rounds) of KIM-1 concentration corrected for urinary creatinine by trichloroethylene exposure category; 12 ppm was the median trichloroethylene concentration of the exposed subjects. P-values are from a linear model testing the pair wise difference in Ln(KIM-1) concentration corrected for ln(creatinine), sex, current alcohol use and BMI between the unexposed and the two exposure categories.

