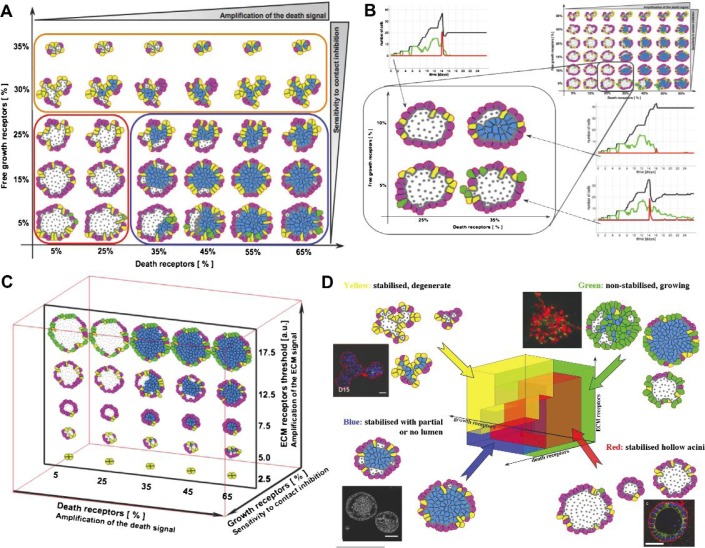
Fig. 3.
(A) A 2D morphochart of final acinar structures produced for different combinations of growth and death receptor thresholds and the ECM threshold fixed at 15×103κ1. (B) A morphochart in which the change of a single threshold (growth or death) still produces a hollow acinus, whereas the simultaneous change of both thresholds results in a partially filled lumen (the ECM threshold fixed at 10×103κ1). (C) A morphochart showing acinar structures produced for the growth receptor threshold fixed at 20% and varied thresholds for death and ECM receptors. (D) A 3D IBCell parameter space defining cell sensitivity to growth, death and ECM signals divided into four colour-coded morphology classes: normal hollow acini (red), filled lumen acini (blue), small degenerated acini (yellow) and non-stabilized acini (green). Insets show examples of similar morphologies observed in 3D in vitro cultures; clockwise: MCF10A-Ras-Scribble (green) from Dow et al. (2008, Fig. 4d); MCF10A (red) from Debnath et al. (2003, Fig. 5C); RWPE-1/rA1 (blue) from Inokuchi et al. (2009, Fig. 2A) and MCF10A/Mek2-DD (yellow) from (Reginato et al., 2005, Fig. 7B). All figures reproduced with permission.

