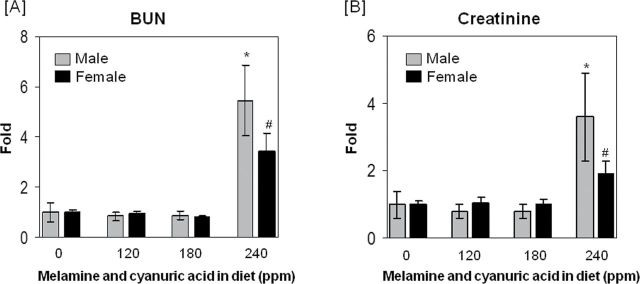
FIG. 1.
BUN and Cr changes in F344 rats after 28-day exposure to diet containing 0 (control group), 120, 180, or 240 ppm of MEL and CYA. At the end of study, blood was collected for BUN (panel A) and Cr (panel B) analysis. The data are expressed as means ± SD for each dose group (n = 8). BUN (control) = 17.1±6.3mg/dl (male), 16.4±1.92mg/dl (female); serum Cr (control) = 0.5±0.2mg/dl (male), 0.44±0.05mg/dl (female). Symbol * and # indicate the statistically significant difference with p < 0.05 between control and treatment group in male and female rats, respectively.

