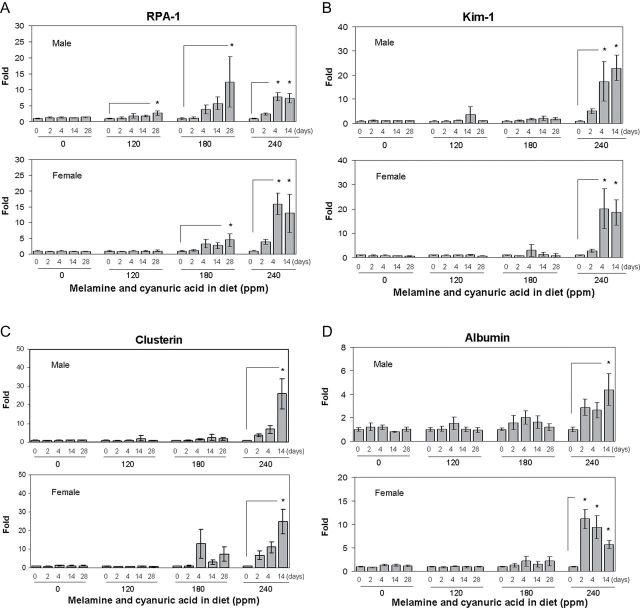
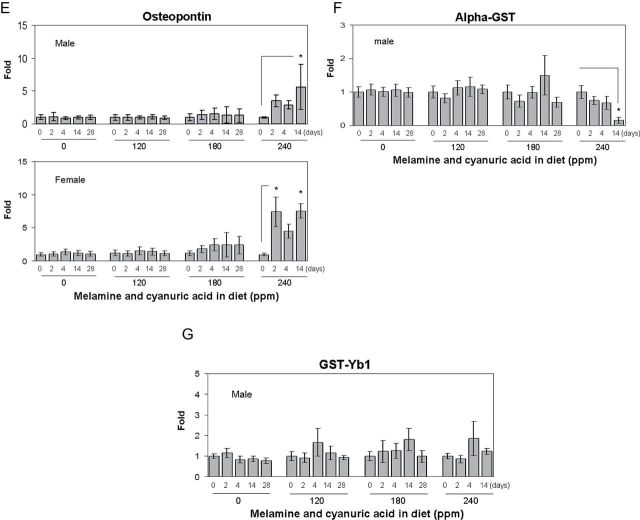
FIG. 2.
Urinary biomarkers analysis in F344 rats following a 28-day exposure to diet containing 0 (control group), 120, 180, or 240 ppm of MEL and CYA. (A) RPA-1, (B) Kim-1, (C) clusterin, (D) albumin, (E) osteopontin, (F) alpha-GST, and (G) GST-Yb1. All the above urinary biomarkers are normalized by urinary Cr concentration. Data are expressed as mean ± SD for each group (n = 8). RPA-1 (control) = 1.45±0.36 µg/mg Cr (male), 1.75±0.31ng/mg Cr (female); Kim-1 (control) = 0.82±0.15ng/mg Cr (male), 1.08±0.24ng/mg Cr (female); clusterin (control) = 7.56±2.48ng/mg Cr (male), 4.72±0.71ng/mg Cr (female); albumin (control) = 37.3±12.7 µg/mg Cr (male), 10.4±2.7 µg/mg Cr (female); osteopontin (control) = 2.01±0.79ng/mg Cr (male), 2.75±1.44ng/mg Cr (female); alpha-GST (control) = 99.6±31.8ng/mg Cr (male); GST-Yb1 (control) = 20.8±5.06ng/mg Cr (male). Urine for day 28 from rats at high dose group (240 ppm) is not analyzed due to advanced renal damage. Asterisks represent statistically significant difference compared with samples obtained on day 0 within each dose group (p < 0.05).


