
FIG. 3.
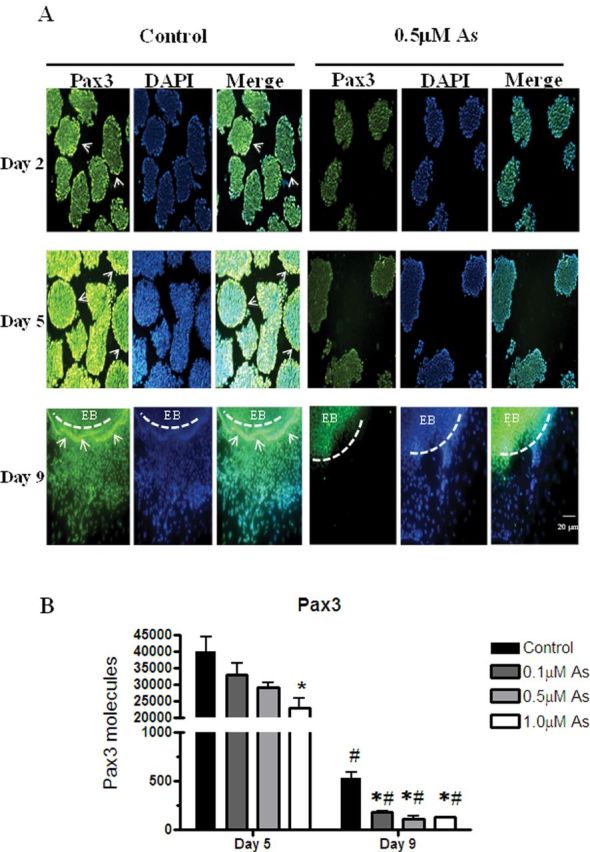
Arsenic represses Pax3 expression in the exterior regions of EBs. P19 cells were aggregated in the presence or absence of 0.5μM sodium arsenite for 5 days, then transferred to gelatin-coated plates for 4 days (day 9) with or without 0.5μM sodium arsenite to examine Pax3 expression by immunofluorescence (A). Arrows indicates the exterior regions of EBs with induced Pax3 expression. Dashed lines indicate the location of an EB. Pictures are representative examples from 198 independent EBs per time point per group. Pax3 mRNA expression on day 5 and day 9 from cells exposed to 0, 0.1, 0.5, or 1.0μM sodium arsenite was quantified by qPCR. Each sample was run in triplicate (n = 3), results were normalized to GAPDH, and are expressed as the average normalized number of molecules per 100ng cDNA. Statistical differences were determined by ANOVA followed by Tukey’s post hoc test (p < 0.05) to determine statistical differences between concentrations (*) and between days (#) (B).