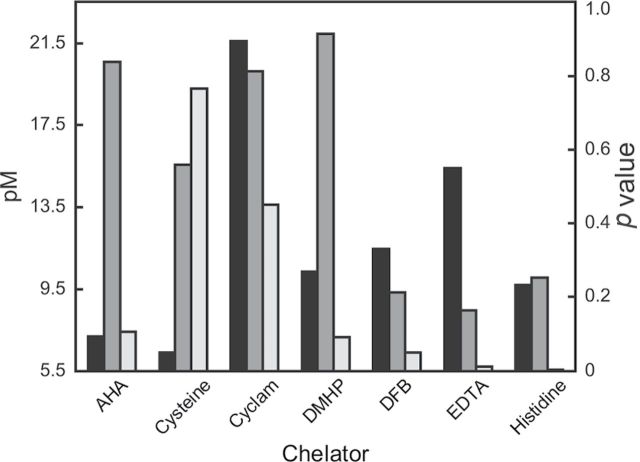
FIG. 2.
Histogram correlating pM values (black bars) of individual chelators with copper to calculated p values for survival (dark gray bars) or log EXT (light gray bars) after the treatment of C. elegans with metal and chelators. pM and p values are taken from Supplemental Table S1 and Table 3, respectively. DFB, desferrioxamine B.

