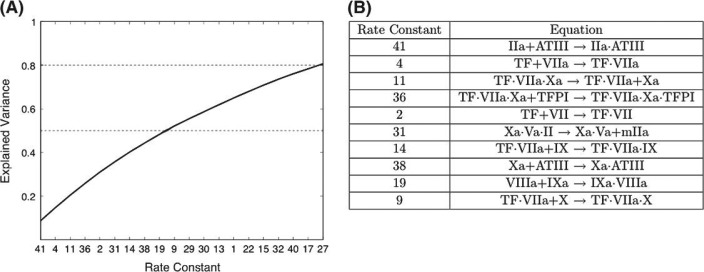
Fig. 4.
Ranking rate constants by the effect that uncertainty in their values has on thrombin levels. The explained variance is defined as the time-averaged coefficient of variation for thrombin for a given ki expressed as a fraction of the sum of all the time-averaged coefficients of variation for IIa for all 44 ki. Panel A: rate constants (x-axis, see Appendix for list of equations) ranked in descending order by the magnitude of their contribution (Γj) to the overall variance (y-axis). The line displays the aggregate explained variance as each rate constant’s contribution is added. Panel B: the reactions governed by the 10 rate constants where uncertainty in the rate constants has the greatest effect on thrombin levels.

