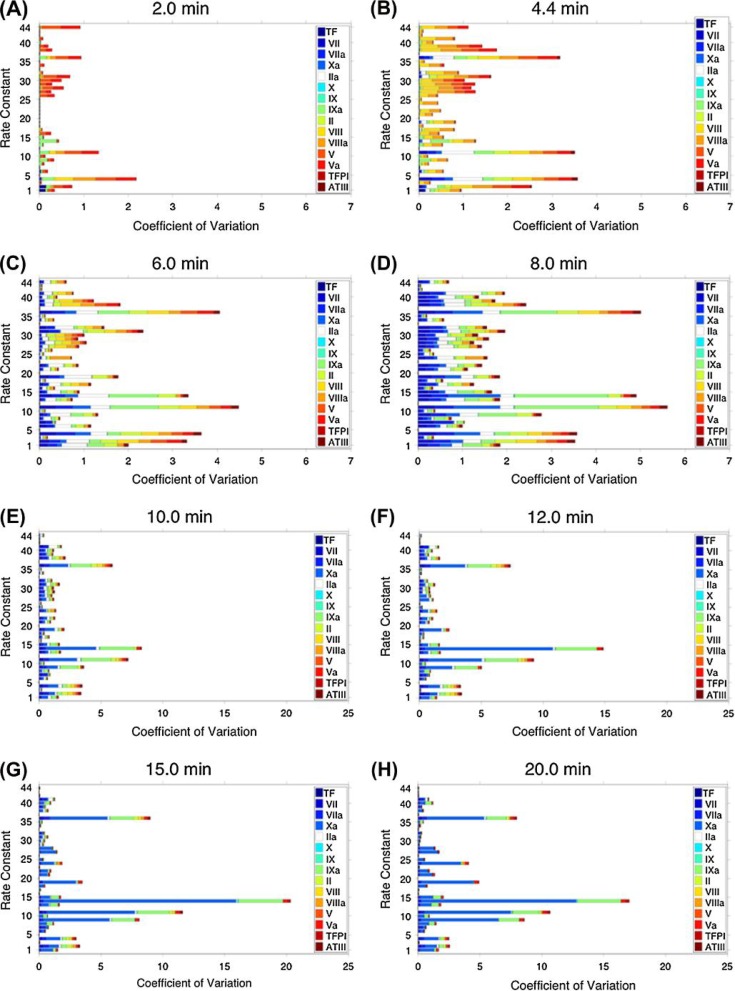
Fig. 5.
Sensitivity of a selected group of model species across the 10–1000% parameter range for each rate constant. Protein species are identified by colors and block size represents the magnitude of the coefficient of variation ( , x-axis) for each species for each k1−44 (y-axis) at t = 2, 4.4, 6, 8, 10, 12, 15 and 20 min.

