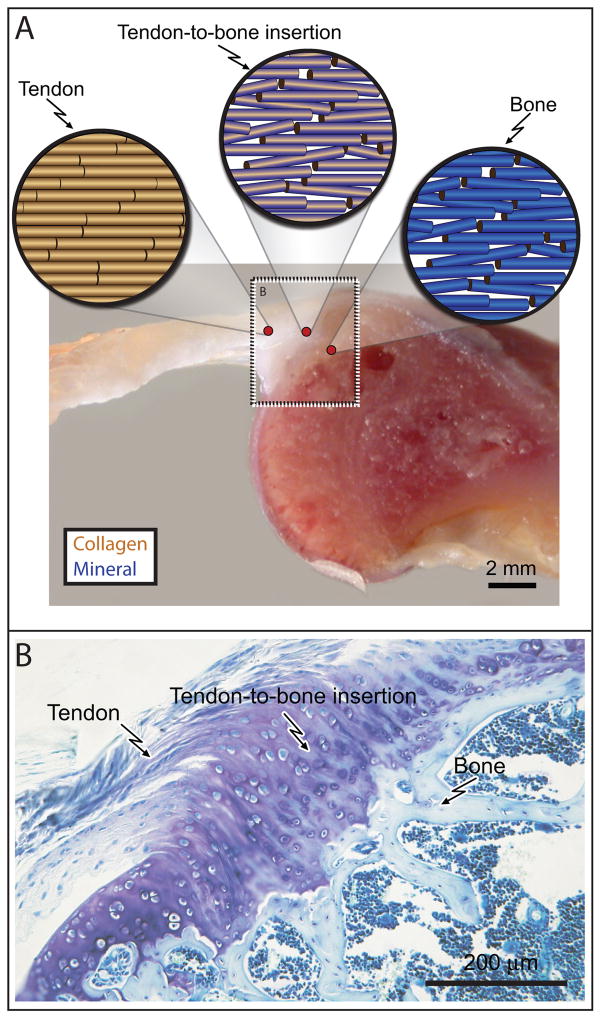
Figure 1.
(A) A schematic of collagen fibers is shown above a cross-sectional view of a rat supraspinatus tendon-to bone insertion. Blue shading indicates the concentration of mineral within each fiber. Note that the collagen fiber orientation distribution becomes less organized from tendon to bone. (B) A histologic section of a rat supraspinatus tendon-to-bone insertion is shown, demonstrating the change in cell morphology and matrix composition from tendon to bone (Toluidine blue stain).

