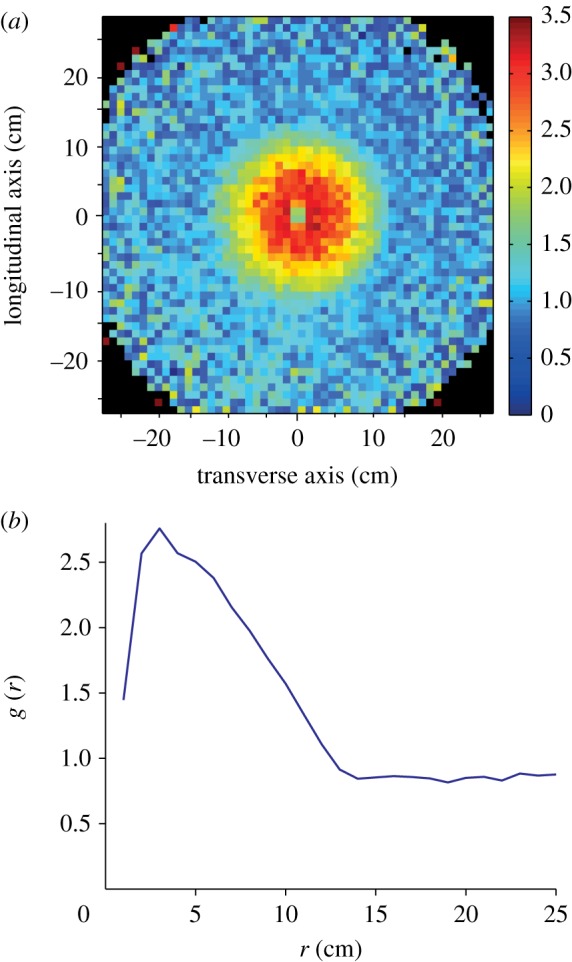
Figure 2.

(a) Relative density of neighbours around a focal individual. The longitudinal axis represents the relative densities (colour coded; positions with no data shown in black) of neighbours along the axis defined by the body orientation of the focal individual, with positive values ahead of it and negative ones behind. The transverse axis represents neighbours’ densities along the axis perpendicular to the body of the focal individual, with negative values representing positions to the left of it and positive ones to the right. In the empirical data, a gap with lower densities is observed at very close range (within 1 cm), while a ring of higher densities is observed a few centimetres away from the individual and spread over roughly 10 cm until the values fall back towards 1, indicative of a homogeneous distribution of neighbours. (b) Pair correlation function g(r) in the empirical data. There is a clear peak at a distance of around 3 cm, which further indicates some clustering of neighbours at that distance and repulsion between individuals at distances below it.
