Figure 5.
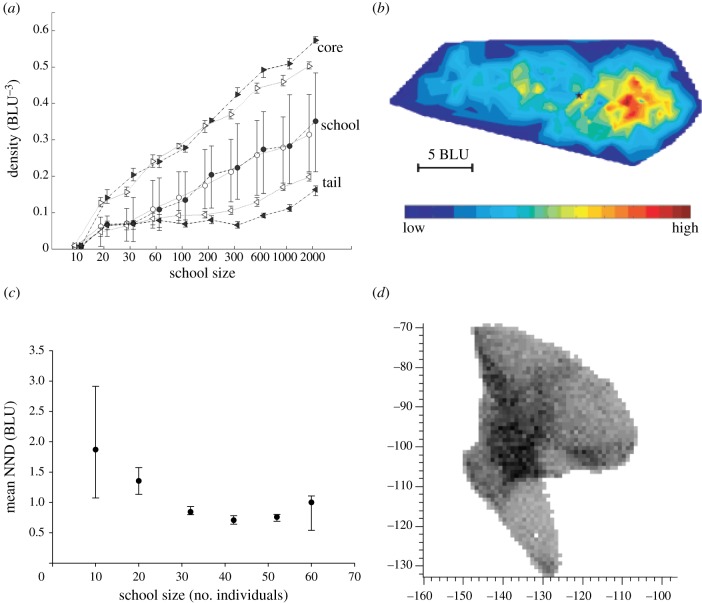
Density and size of schools of fish. (a) Density (number of individuals per volume) in schools of different sizes in model of fish schools (median and interquartile) [15]. Open symbols indicate slow schools, and filled symbols refer to fast schools. Core has highest density indicated in red, tail comprises 10% individuals at the very back. Lowest density in dark blue. (b) Density in different parts of the school in infinite space [15]. (c) Average nearest-neighbour distance (NND) (median and interquartile) in empirical data of schools of 10–60 mullets in the narrow passage of the ring-shaped tank [28]. (d) Shape and internal density of school of 10 000 individuals with occluded perception [16]. Grey scale indicates local density and ranges from 0 to 20 individuals m−2.

