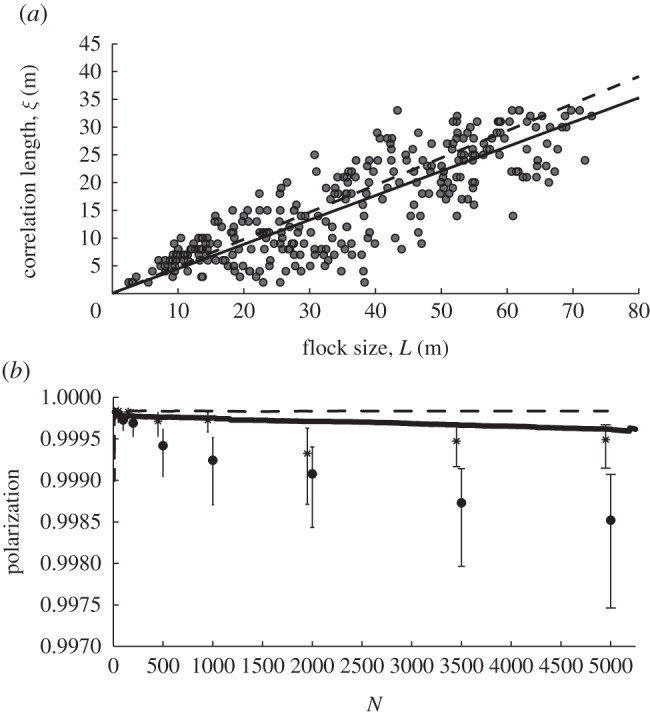
Figure 7.

Deviation from the average of heading and velocity among individuals in the flock [47]. (a) Scale-free correlation between correlation length of deviation of velocity from that of the centre of gravity versus length of the flock (flock length is measured by the largest distance (metre) between two individuals in the flock) for 6.5 interaction partners where slope is 0.44 (solid line and dots) and for 50 interaction neighbours where slope is 0.48 (dashed line). (b) Decrease in polarization with flock size and with fewer interaction neighbours. Polarization (global and local) versus number of individuals in the flock for low number of interaction partners of 6.5 individuals (solid line, global; and black dots, local) and high number, 50 (dashed line and stars). N denotes number of flock members. Values and error bars indicate median and interquartile.
