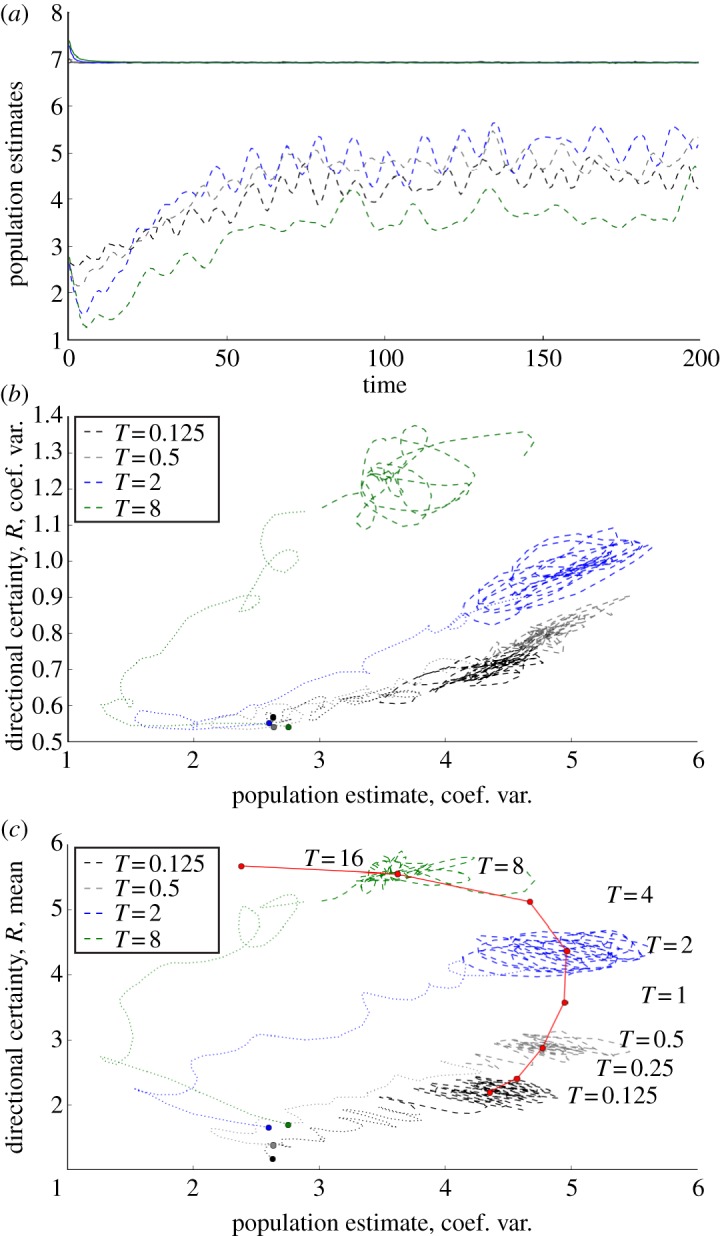
Figure 3.

Variation in cognitive variable fields as functions of memory timescale parameter, T. In all plots, T = 0.125, 0.5, 2, 8 are represented by black, grey, blue and green lines, respectively. (a) Time series of spatially averaged estimated population density (ρ) within the ‘nearest neighbourhood’ (i.e. within rNN = 2.1) of each position in the domain (solid lines). As expected, estimates of population average converge approximately on a timescale T. However, coefficients of variation (dashed lines) show long transients, reflecting extended approaches to statistical stationarity in group density and extent. (b) Spatially averaged ‘directional certainty’ R (solid lines) and its coefficient of variation (dashed lines) also show extended transients. The strong increases of directional certainty with T reflect the increased information available to animals with longer memories. (c) Plots of estimated population density (ρ) coefficient of variation against spatially averaged directional certainty (R). In this panel, initial transients (t ≤ 48) are shown as dotted lines and longer timescale dynamics (48 ≤ t ≤ 200) as dashed lines. Initial conditions are shown as filled circles. Trends in the ρ–R relationship are further illustrated by red circles, representing time averages of mean ρ and coefficient of variation of R over the interval 48 ≤ t ≤ 200. The curve connecting these circles suggests that a maximum variation of population density occurs at T ≈ 1, suggesting a possible transition between ‘short’ and ‘long’ memory timescale dynamics.
