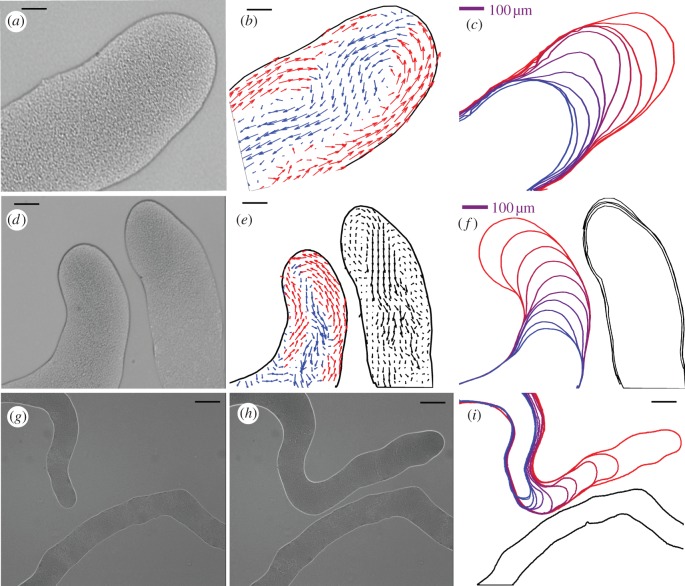
Figure 2.
Interactions between swarms. (a) An example of snake-like swarm of P. vortex. The figure shows a swarm generated during growth on reduced strength Mueller Hinton medium gelled with 1.5% w/v Eiken agar (RMHA). An optical microscopic picture of the swarm. The small dots are the individual cells. (b) Velocity field of the bacteria swarming calculated as explained in the text. At each point, the average velocity of several neighbouring cells is calculated. The red arrows indicate a flow towards the tip of the swarm, and the blue arrows indicate a backward flow. The size of the arrows corresponds to the magnitude of the computed flow. (c) The envelope of the swarm at successive times illustrating the vortex movement. (d) Close view of repulsion between two swarms. Parts (e,f) are similar to (b,c). (g) A global view of repulsion between two swarms. Parts (h,i) are similar to (b,c). Note the slow down in the swarm movement when another swarm is detected and the increase in speed after the change in the swarm direction. Scale bars, (g,h,i) 140 µm.

